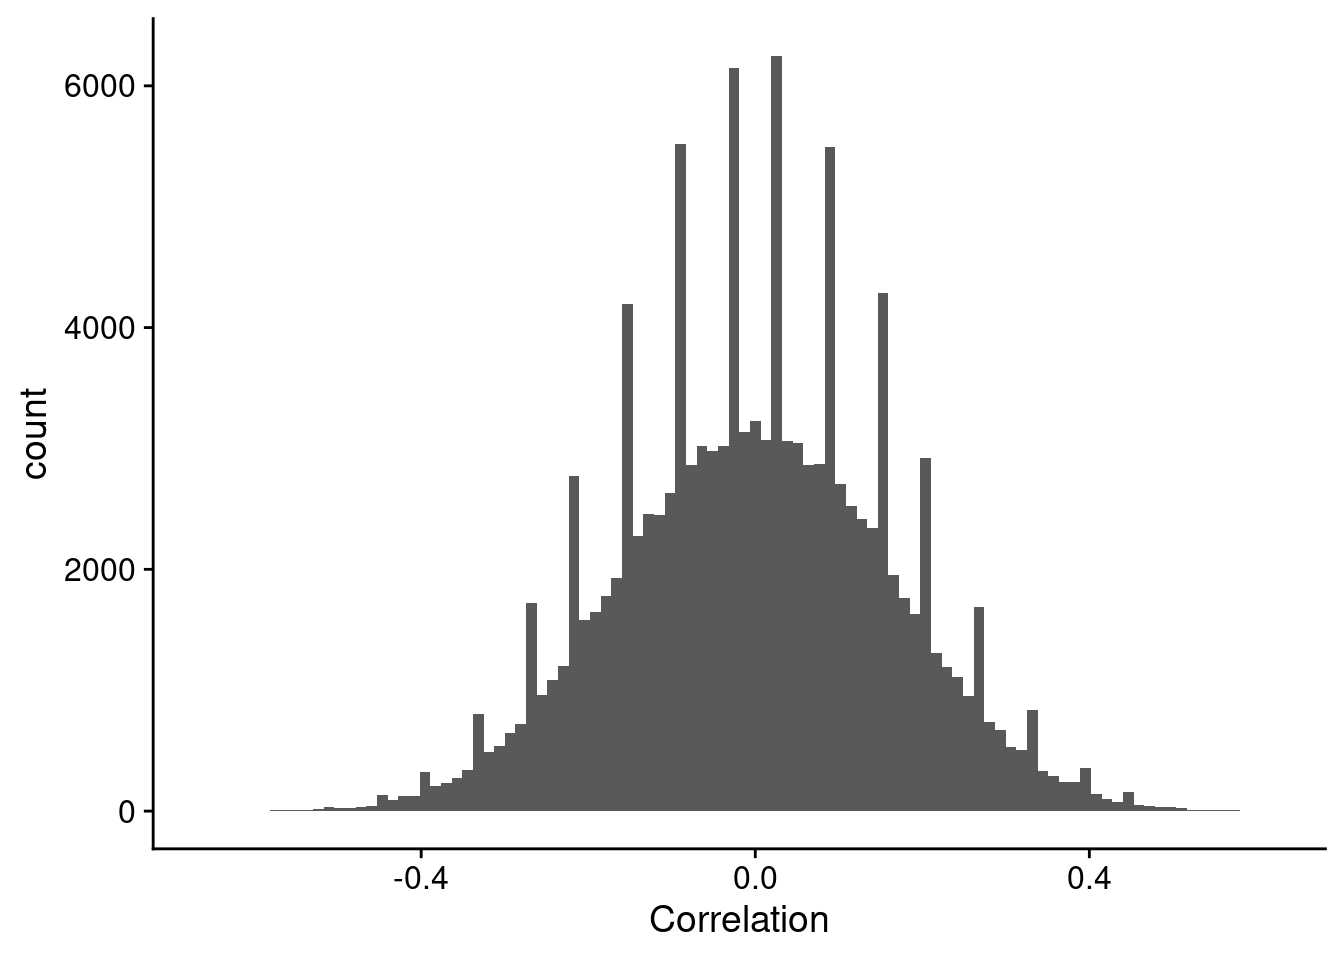
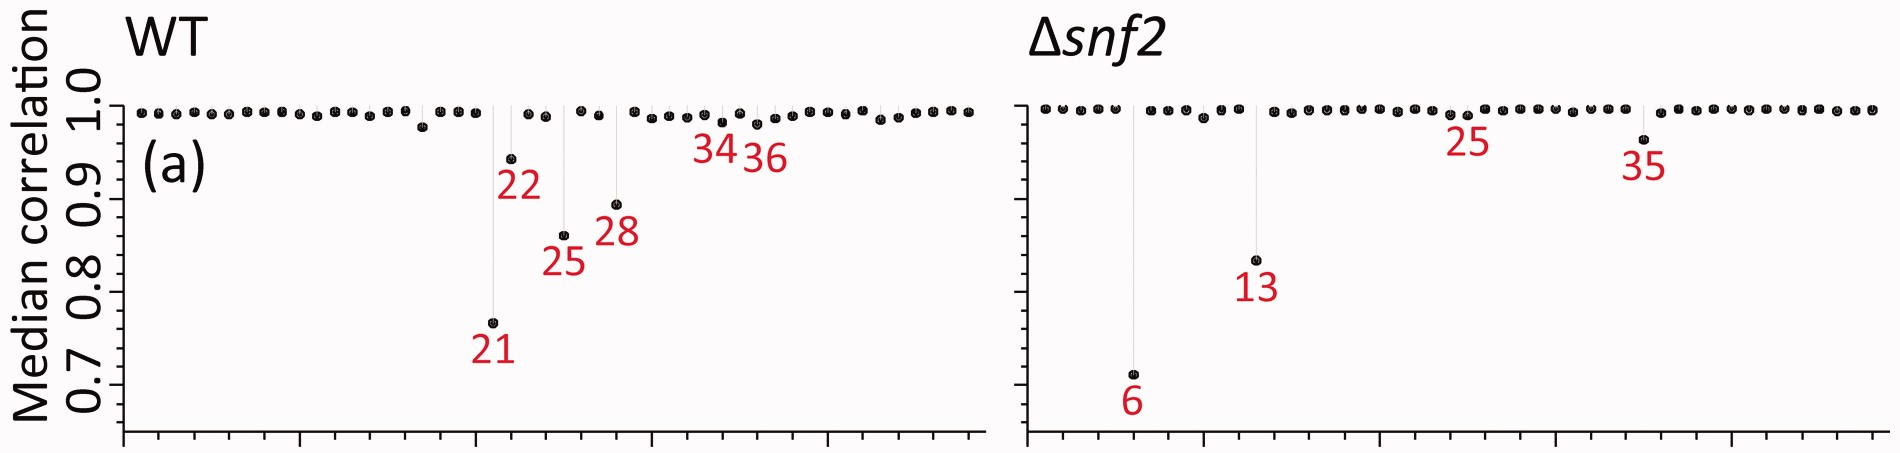
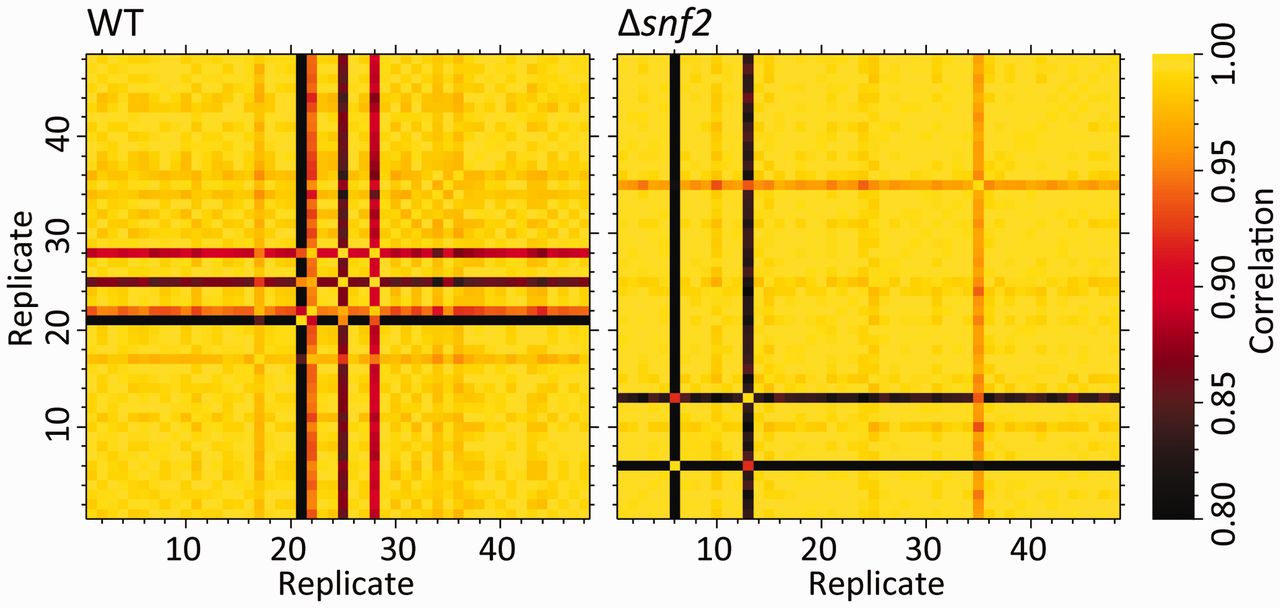
Weird Correlation Patterns
R
correlation
analysis
bioinformatics
Installing OpenBLAS for self-compiled R
R
profiling
openblas

Blog Posts as Email Newsletters
R
newsletters
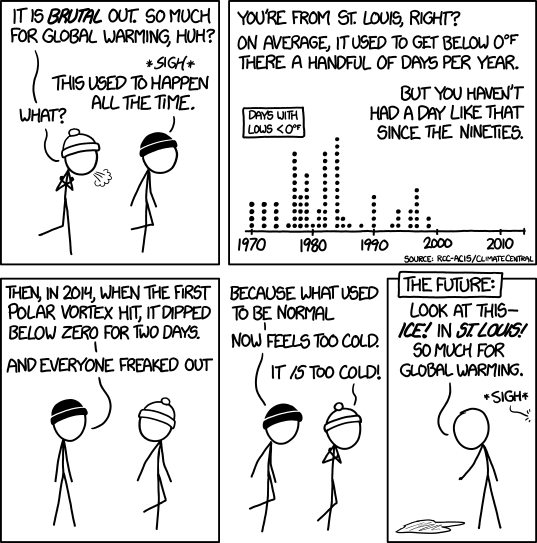
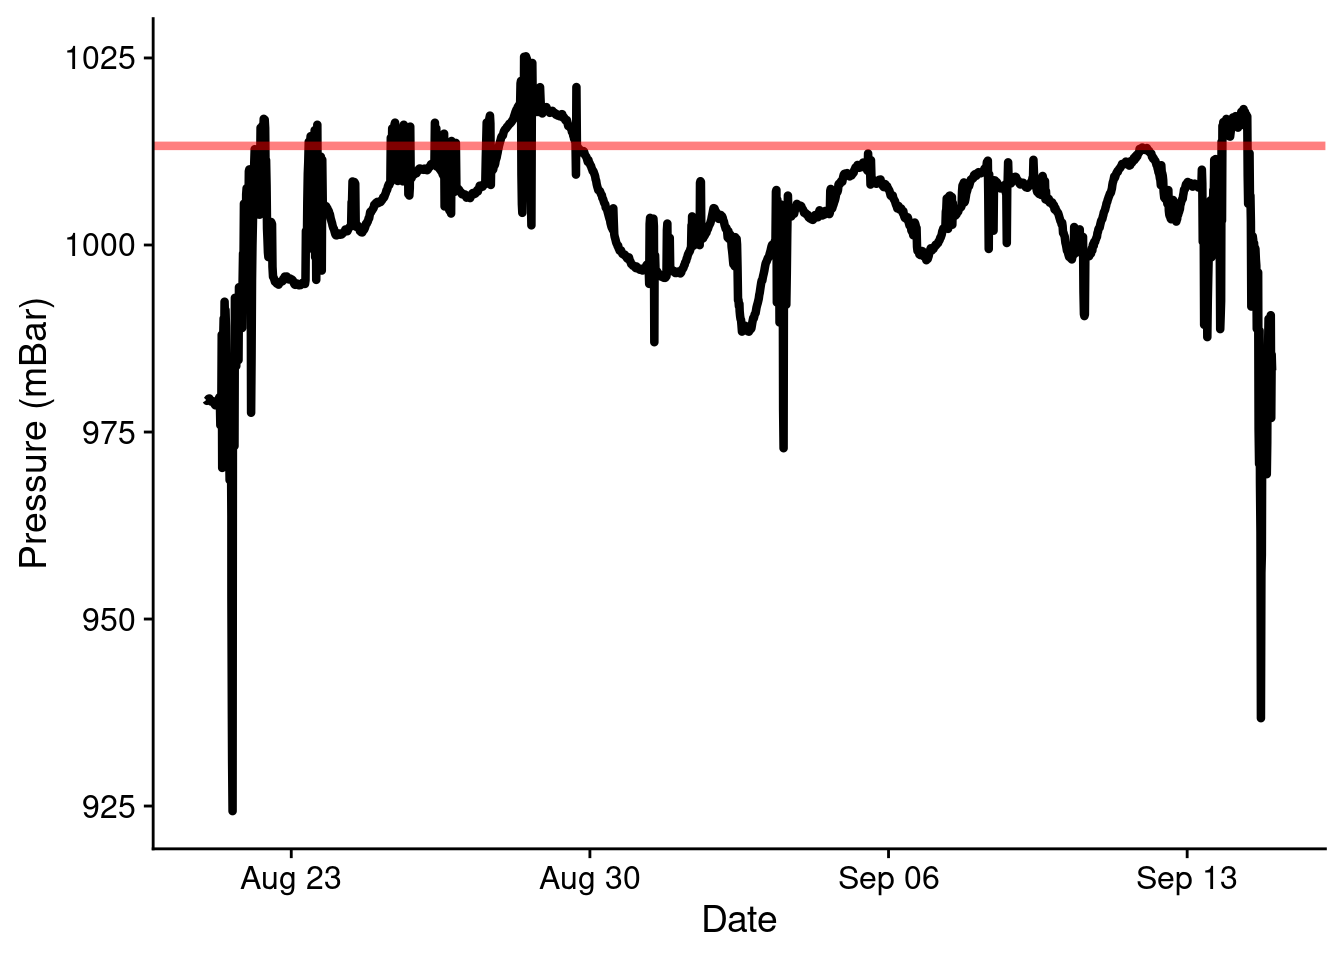
Climate Data to Analyze Days by Low Temperatures
xkcd
climate-data

Measuring Changes in Height Over Time
R
development
citizen-science
height
Creating an Analysis With a targets Workflow
analysis
development
mass-spectrometry
targets
Compiling Against Python.h
python
cython
random-code-snippets
Heatmap Colormaps!
colormaps
visualization
heatmap
random-code-snippets
Recreating Correlation Values from Another Manuscript
reproducibility
correlation
Dplyr in Packages and Global Variables
random-code-snippets
packages
dplyr
rlang
R
development
Migrating Self-Hosted GitLab Projects to GitHub
version-control
github
gitlab
Random Forest Classification Using Parsnip
parsnip
tidymodels
machine-learning
random-forest
random-code-snippets
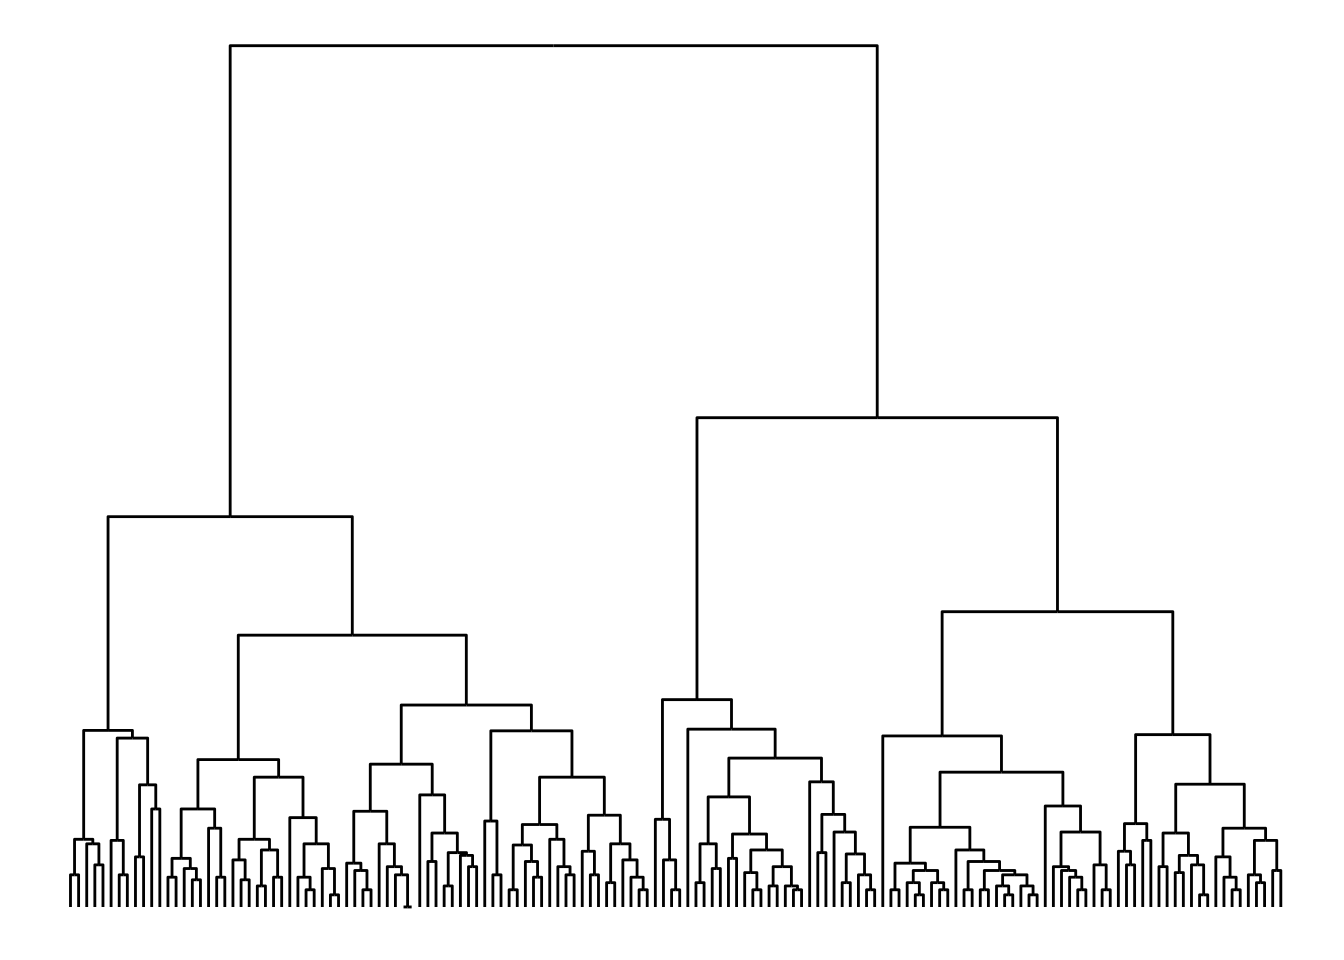
Coloring Dendrogram Edges with ggraph
random-code-snippets
visualization
graphing
dendrogram
Keeping Figures in an Rmd – Word Document
random-code-snippets
reproducibility
rmarkdown
My Geographic Introduction
maps
graphing
visualization
animation
Proportional Error in Mass Spectrometry
mass-spectrometry
proportional-error
omics
metabolomics
Highlighting a Row of A ComplexHeatmap
random-code-snippets
heatmap
visualization
Creating a Map of Routes Weighted by Travel
graphing
maps
visualization
Packages Don’t Work Well for Analyses in Practice
R
development
packages
vignettes
programming
analysis
workflow
targets
drake
Things I Learned About distill
distill
blogdown
rmarkdown
Using group_by Instead of Splits
R
dplyr
split
group-by
programming
development
Introducing Scientific Programming
R
reproducibility
programming
academia
Comparisons using for loops vs split
R
for-loop
split
purrr
development
Don’t do PCA After Statistical Testing!
pca
bioinformatics
R
t-test
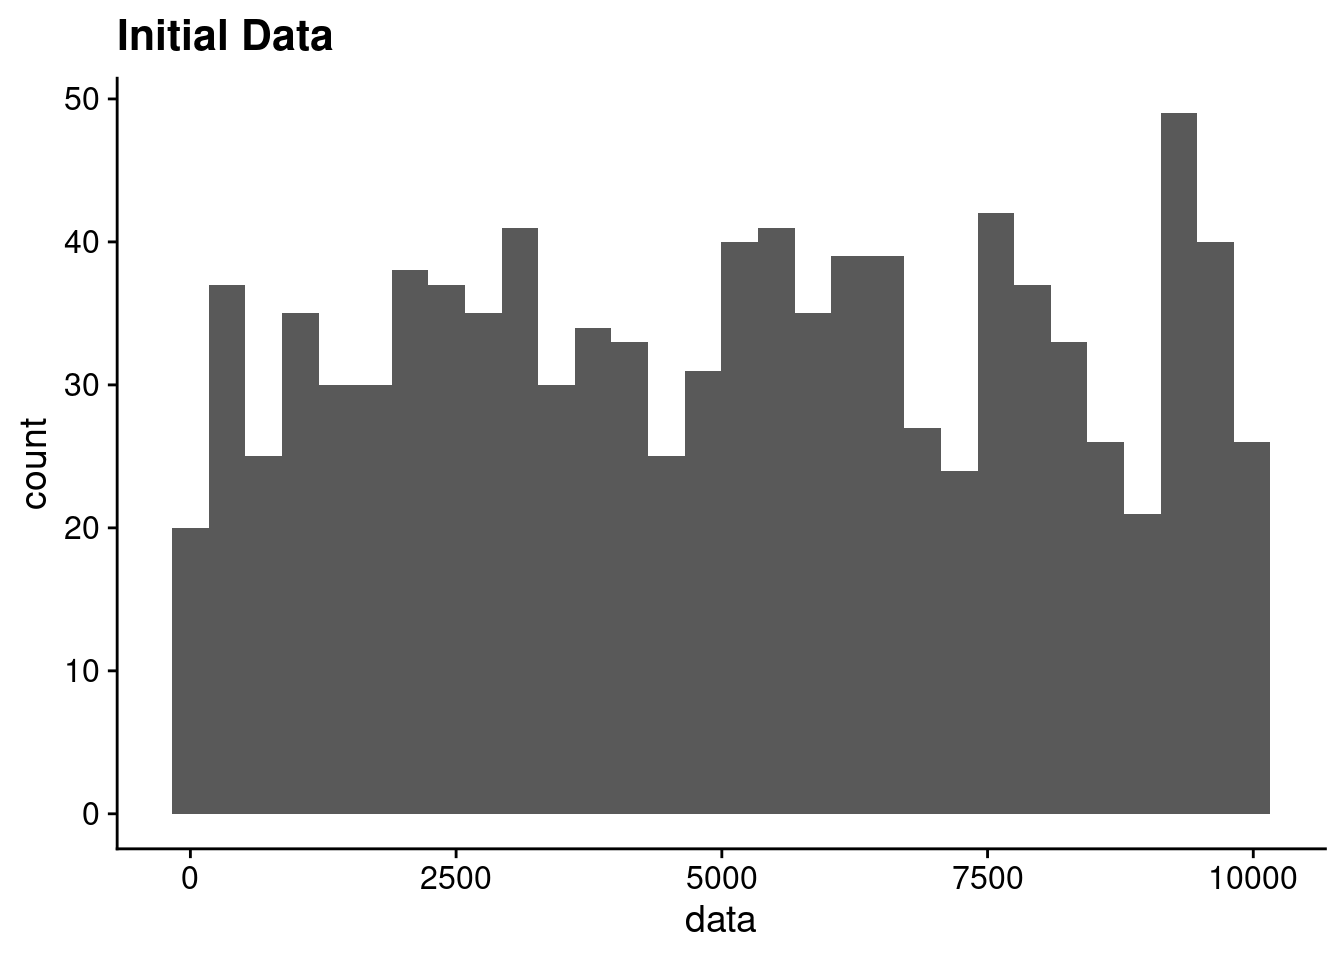
Finding Modes Using Kernel Density Estimates
R
python
kernel-density
pdf
probability-density
programming
Split - Unsplit Anti-Pattern
R
development
programming
purrr
dplyr
join

Using IRanges for Non-Integer Overlaps
R
iranges
development
programming
knitrProgressBar Package
packages
R
developement
Licensing R Packages that Include Others Code
R
packages
open-science
licensing

Linking to Manually Inserted Images in Blogdown / Hugo
hugo
R
blogdown
Differences in Posted Date vs sessionInfo()
development
blogdown
I was Part of the Problem
metoo
academia
Criticizing a Publication, and Lying About It
Critics of our last publication claimed we didn’t make our data available, which is an outright lie.
publications
peer-review
zinc
academia
Authentication of Key Resources for Data Analysis
reproducibility
open-science
analysis
Random Forest vs PLS on Random Data
random-forest
machine-learning
partial-least-squares
statistics
analysis
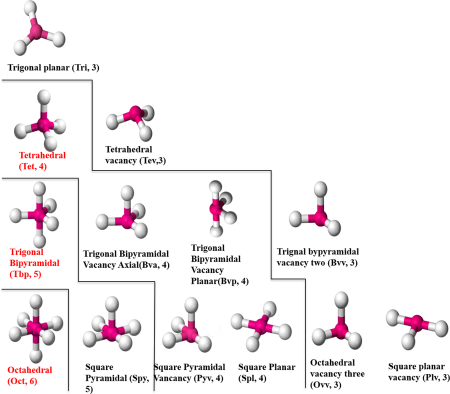
Novel Zinc Coordination Geometries
zinc
structural-biochemistry
open-science
reproducibility
visualization
publications
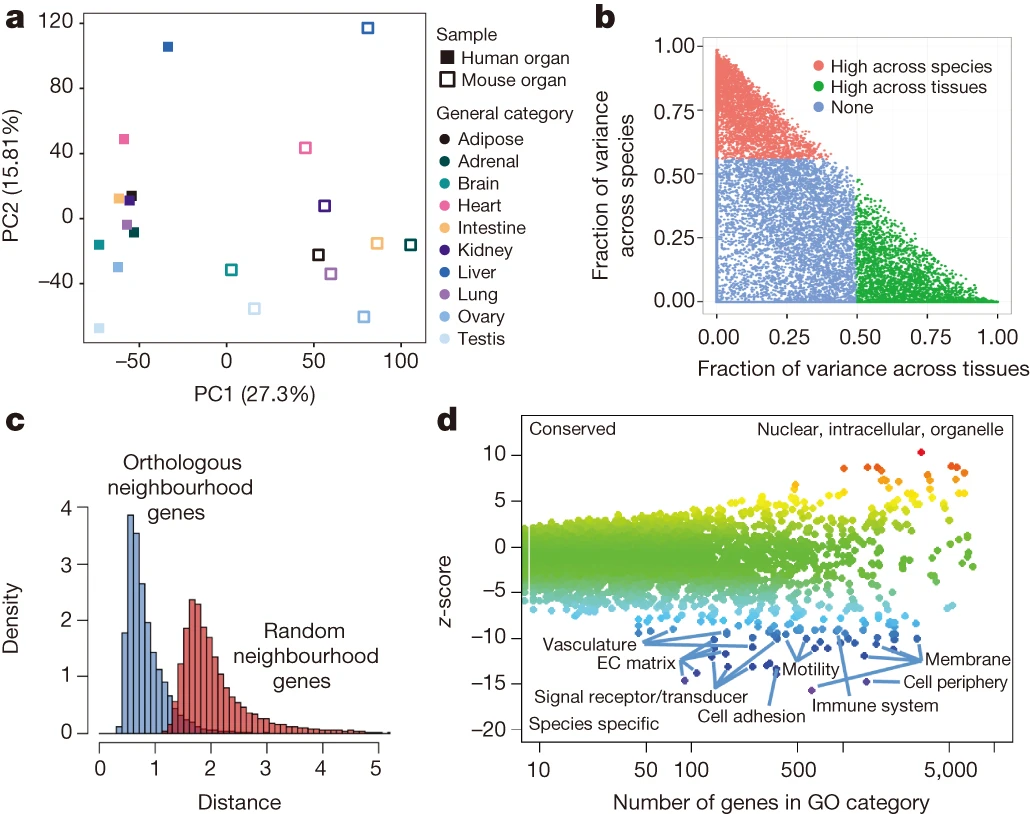
Mouse / Human Transcriptomics and Batch Effects
open-science
transcriptomics
batch-effects
publications
peer-review
First Open Post-Publication Peer Review, with Credit!
open-science
peer-review
publications
Being a PhD Student and Post-Doc with Migraines
phdisabled
migraines
academia
Travis-CI to GitHub Pages
R
reproducibility
travis-ci
github
publishing
Analyses as Packages
R
development
packages
vignettes
programming
analysis
Creating an Analysis as a Package and Vignette
R
development
packages
vignettes
analysis
programming
Researcher Discoverability
github
open-science
academia
research
Bioinformatics Presentations that Lack Results (or Biological Relevance)
bioinformatics
academia
research
categoryCompare Paper Finally Out!
R
bioconductor
meta-analysis
publications
git
github
open-science
visualization
annotation-enrichment
Self-Written Function Help
Do you want to be able to read function documentation for your own functions? Make your own package.
R
packages
documentation
development
devtools
roxygen2
docstrings
Package Version Increment Pre- and Post-Commit Hooks
R
git
packages
development
programming
random-code-snippets
Open vs Closed Analysis Languages
open-science
R
python
MatLab
programming
development
Pre-Calculating Large Tables of Values
R
pre-calculations
programming
development
c++
Portable, Personal Packages
R
packages
development
K-12 Wants Scientists!!
post-doc
academia
science
teaching
R, RStudio, and Release and Dev Bioconductor
R
bioconductor
rstudio
programming
packages
development
Reproducible Methods
open-science
reproducibility
bioinformatics
Storing Package Data in Custom Environments
R
packages
Writing Up Scientific Results and Literate Programming
literate-programming
academia
notebooks
reproducibility
Writing Papers Using R Markdown
R
open-science
reproducibility
literate-programming
rmarkdown
Creating Custom CDFs for Affymetrix Chips in Bioconductor
R
bioconductor
bioinformatics
cdf
affymetrix
microarray
random-code-snippets
No matching items