
n_feat = 10000
n_sample = 100
random_data = matrix(rnorm(n_feat * n_sample), nrow = n_feat, ncol = n_sample)TL;DR
If you do a statistical test before a dimensional reduction method like PCA, the highest source of variance is likely to be whatever you tested statistically.
Wait, Why??
Let me describe the situation. You’ve done an -omics level analysis on your system of interest. You run a t-test (or ANOVA, etc) on each of the features in your data (gene, protein, metabolite, etc). Filter down to those things that were statistically significant, and then finally, you decide to look at the data using a dimensionality reduction method such as principal components analysis (PCA) so you can see what is going on.
I have seen this published at least once (in a Diabetes metabolomics paper, if anyone knows it, please send it to me so I can link it), and have seen collaborators do this after coaching from others in non-statistical departments.
The Problem
The problem is that PCA is just looking at either feature-feature covariances or sample-sample covariances. If you have trimmed the data to those things that have statistically significant differences, then you have completely modified the covariances, and PCA is likely to pick up on that.
An Example
Let’s actually do an example where there are no differences initially, and then see if we can introduce an artificial difference.
Random Data
We start with completely random data, 10000 features, and 100 samples.
Now we will do a t-test on each row, taking the first 50 samples as class 1 and the other 50 samples as class 2.
t_test_res = purrr::map_df(seq(1, nrow(random_data)), function(in_row){
  tidy(t.test(random_data[in_row, 1:50], random_data[in_row, 51:100]))
})
How many are significant at a p-value of 0.05?
filter(t_test_res, p.value <= 0.05) %>% dim()[1] 514 10Obviously, these are false positives, but they are enough for us to illustrate the problem.
First, lets do PCA on the whole data set of 10000 features.
sample_classes = data.frame(class = c(rep("A", 50), rep("B", 50)))

all_pca = prcomp(t(random_data), center = TRUE, scale. = FALSE)
pca_scores = cbind(as.data.frame(all_pca$x), sample_classes)
ggplot(pca_scores, aes(x = PC1, y = PC2, color = class)) + geom_point()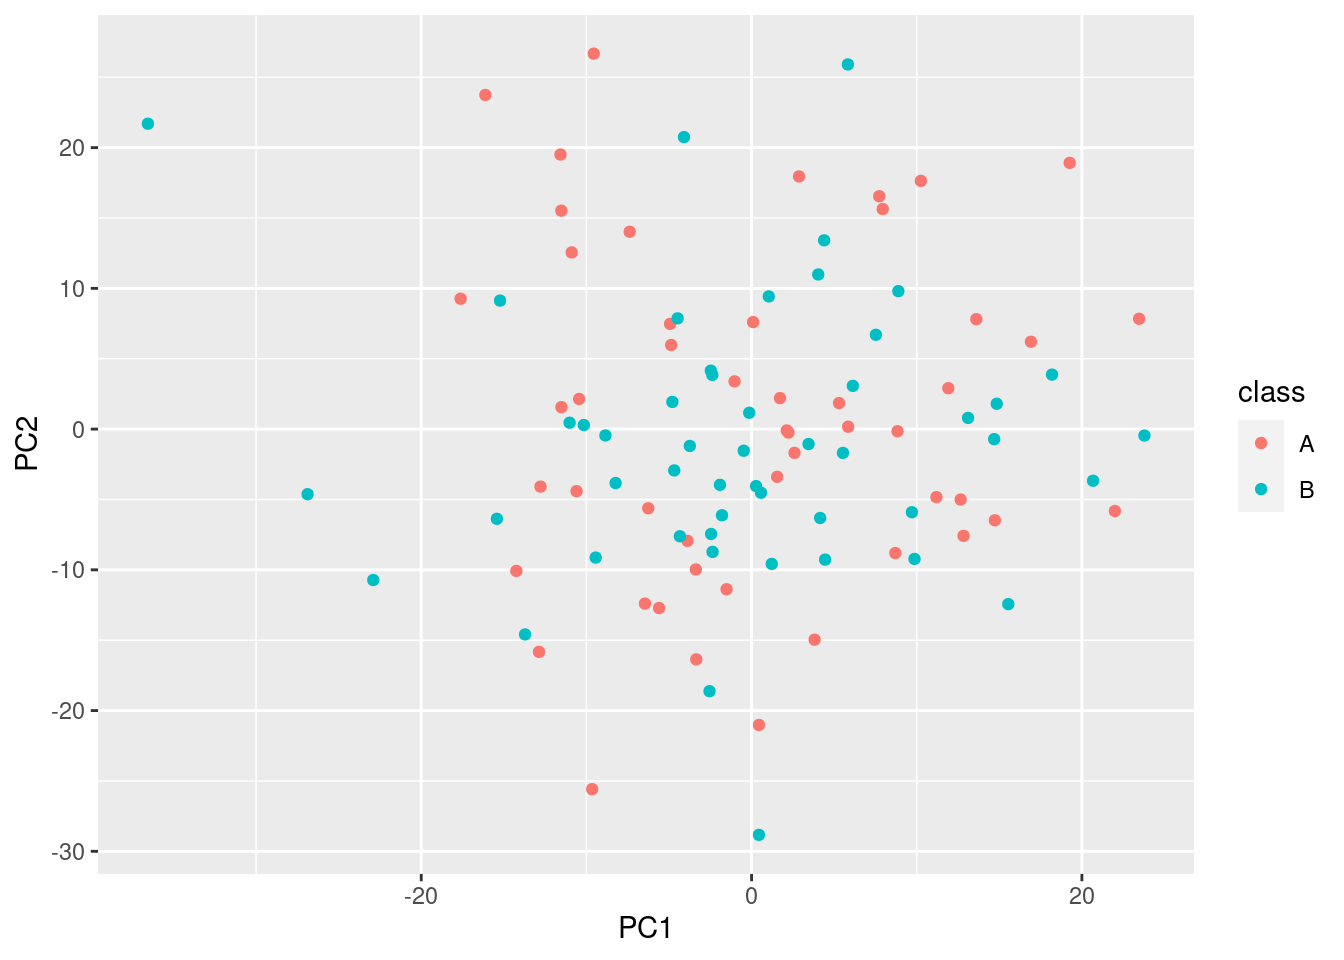
Obviously, there is no difference in the groups, and the % explained variance is very low.
Second, lets do it on just those things that were significant:
sig_pca = prcomp(t(random_data[which(t_test_res$p.value <= 0.05), ]), center = TRUE,
                 scale. = FALSE)
sig_scores = cbind(as.data.frame(sig_pca$x), sample_classes)

ggplot(sig_scores, aes(x = PC1, y = PC2, color = class)) +
  geom_point() +
  theme(legend.position = c(0.5, 0.5))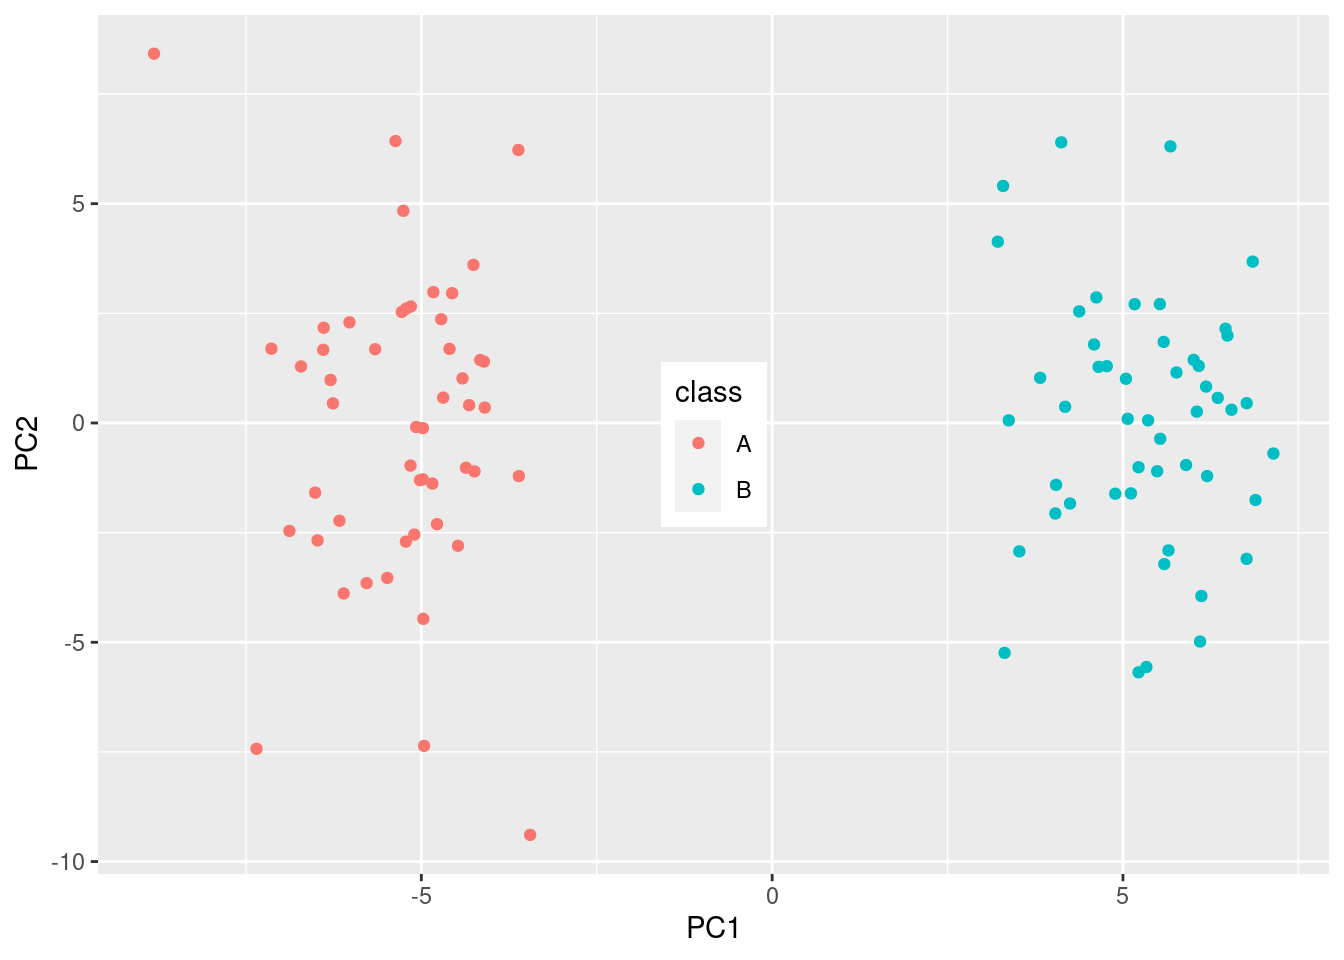
And look at that! We have separation of the two groups! But …., this is completely random data, that didn’t have any separation, until we did the statistical test!
Take Away
Be careful of the order in which you do things. If you want to do dimensionality reduction to look for issues with the samples, then do that before any statistical testing on the individual features.
Reuse
Citation
BibTeX citation:
@online{mflight2018,
  author = {Robert M Flight},
  title = {Don’t Do {PCA} {After} {Statistical} {Testing!}},
  date = {2018-09-14},
  url = {https://rmflight.github.io/posts/2018-09-14-don-t-do-pca-after-statistical-testing},
  langid = {en}
}
For attribution, please cite this work as:
Robert M Flight. 2018. “Don’t Do PCA After Statistical
Testing!” September 14, 2018. https://rmflight.github.io/posts/2018-09-14-don-t-do-pca-after-statistical-testing.