A simple way to highlight or bring attention to a row or column in a ComplexHeatmap.
random-code-snippets
heatmap
visualization
Author
Robert M Flight
Published
March 26, 2021
The ComplexHeatmap Bioconductor package (Gu, Eils, and Schlesner 2016; Gu 2021a, 2021b) has become my goto for visualizing sample-sample correlation heatmaps, which I use a lot. Recently, I had a report where I wanted to highlight a particular row of the heatmap. There is not an easy way that I could find to add something that wraps around a particular column. However, you can indicate that there is a grouping in the heatmap, and use that grouping to separate a sample or samples from the others.
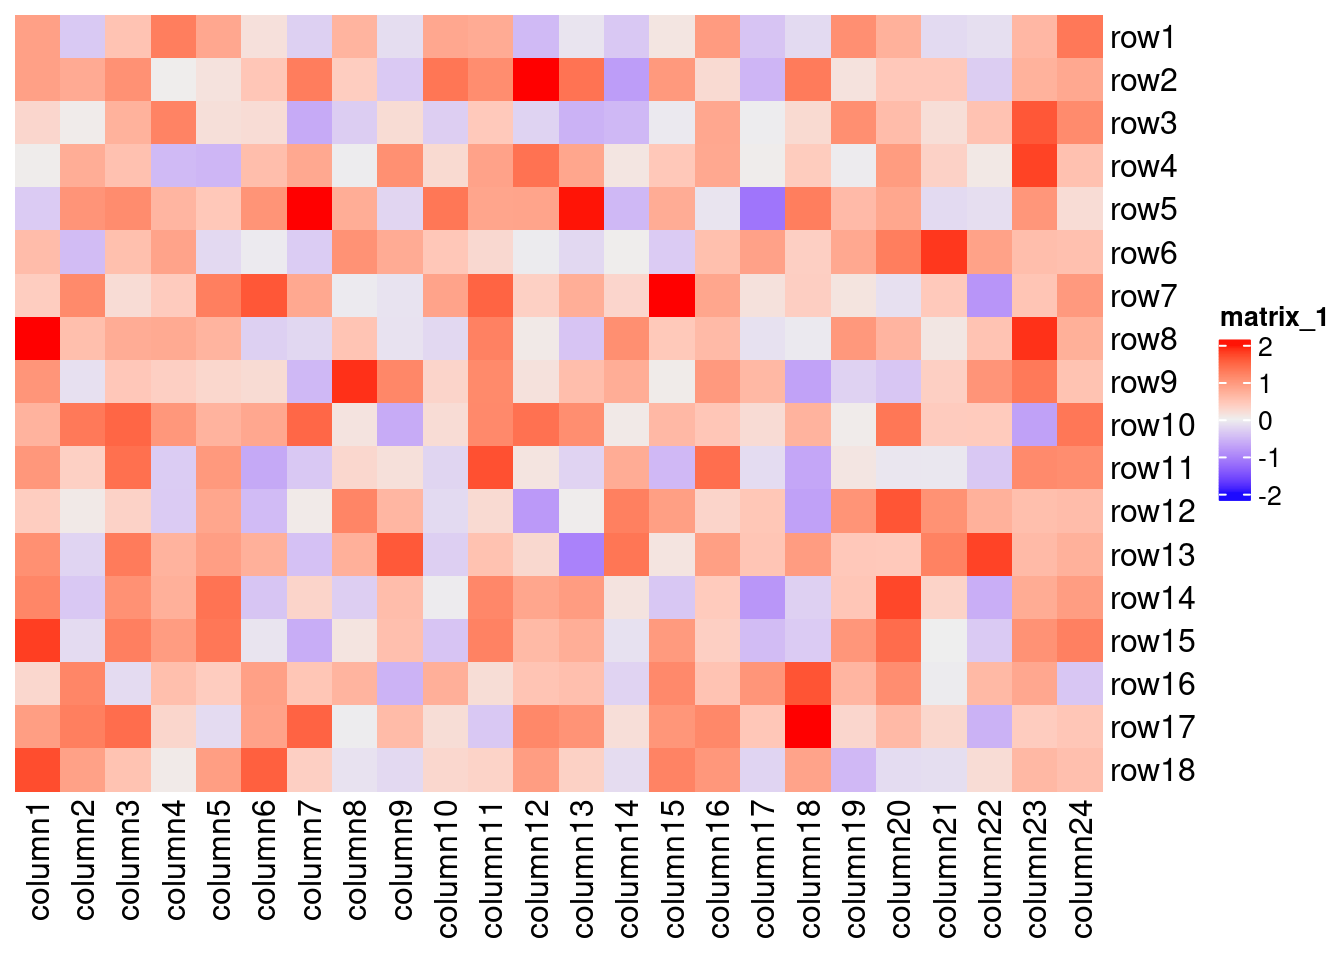
Lets do an example:
library(ComplexHeatmap)set.seed(123)nr1 =4; nr2 =8; nr3 =6; nr = nr1 + nr2 + nr3nc1 =6; nc2 =8; nc3 =10; nc = nc1 + nc2 + nc3mat =cbind(rbind(matrix(rnorm(nr1*nc1, mean =1, sd =0.5), nr = nr1),matrix(rnorm(nr2*nc1, mean =0, sd =0.5), nr = nr2),matrix(rnorm(nr3*nc1, mean =0, sd =0.5), nr = nr3)),rbind(matrix(rnorm(nr1*nc2, mean =0, sd =0.5), nr = nr1),matrix(rnorm(nr2*nc2, mean =1, sd =0.5), nr = nr2),matrix(rnorm(nr3*nc2, mean =0, sd =0.5), nr = nr3)),rbind(matrix(rnorm(nr1*nc3, mean =0.5, sd =0.5), nr = nr1),matrix(rnorm(nr2*nc3, mean =0.5, sd =0.5), nr = nr2),matrix(rnorm(nr3*nc3, mean =1, sd =0.5), nr = nr3)) )mat = mat[sample(nr, nr), sample(nc, nc)] # random shuffle rows and columnsrownames(mat) =paste0("row", seq_len(nr))colnames(mat) =paste0("column", seq_len(nc))Heatmap(mat, cluster_rows =FALSE, cluster_columns =FALSE)
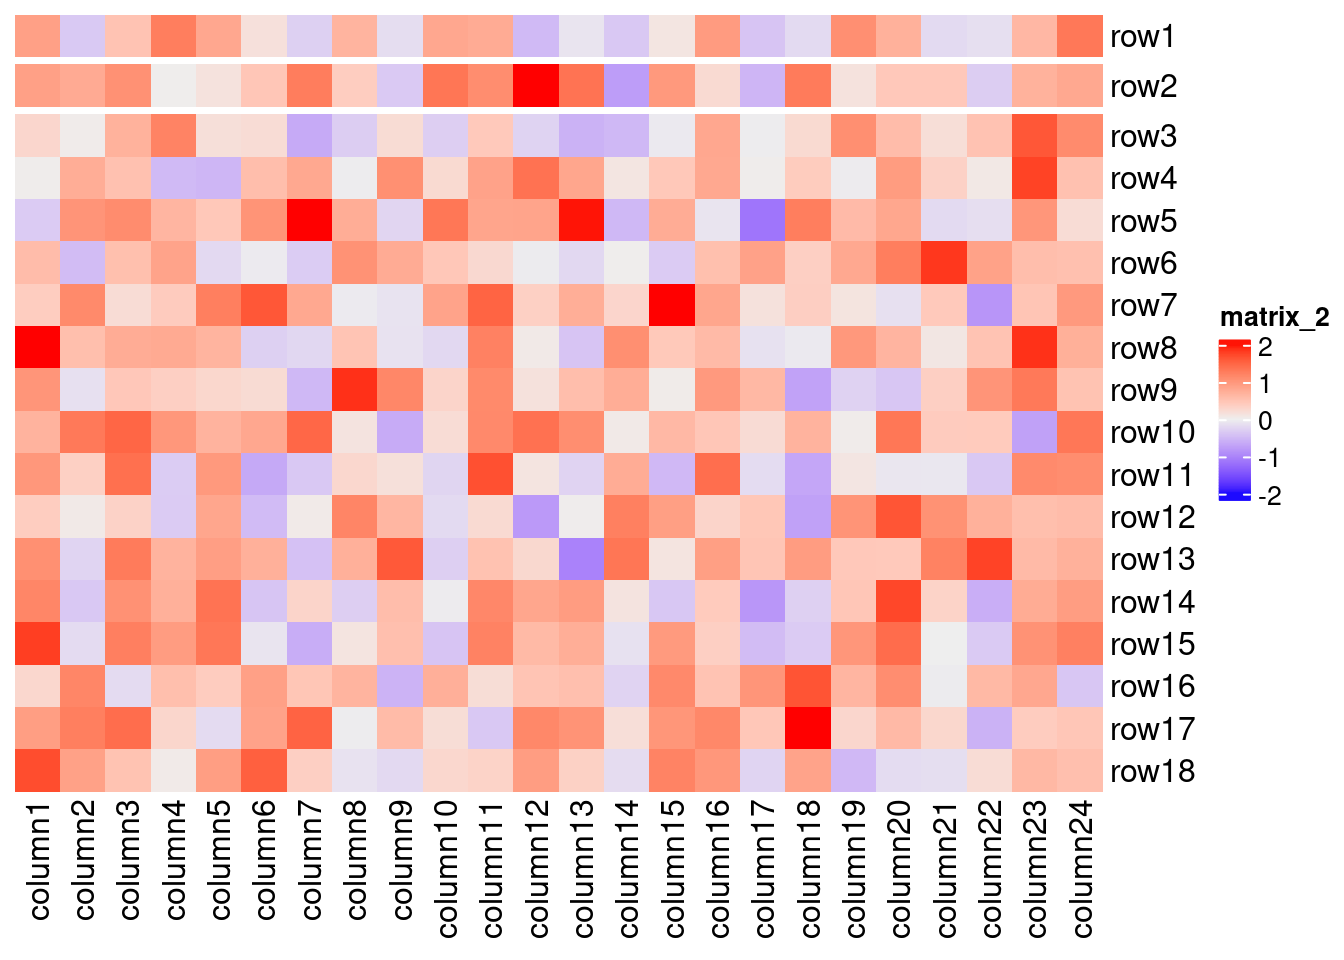
Now, lets suppose we just want to highlight row2.
We create a data.frame with a factor to represent the grouping:
Voila! row2 is separated from the others to draw attention to it. It’s not perfect, but hopefully it’s useful to others. Note, that you can’t use clustering with this method. If you have actual dendrograms to display, this will fail, because ComplexHeatmap expects you to use a numeric argument to tell the cut height for dendrograms for splitting (Gu 2021c). Therefore, if you have dendrograms, reorder your columns and rows according to the dendrogram first and then add the splitting information and keep the clustering off.
Gu, Zuguang, Roland Eils, and Matthias Schlesner. 2016. “Complex Heatmaps Reveal Patterns and Correlations in Multidimensional Genomic Data.”Bioinformatics.
@online{mflight2021,
  author = {Robert M Flight},
  title = {Highlighting a {Row} of {A} {ComplexHeatmap}},
  date = {2021-03-26},
  url = {https://rmflight.github.io/posts/2021-03-26-highlighting-a-row-of-a-complexheatmap},
  langid = {en}
}