Coloring Dendrogram Edges with ggraph

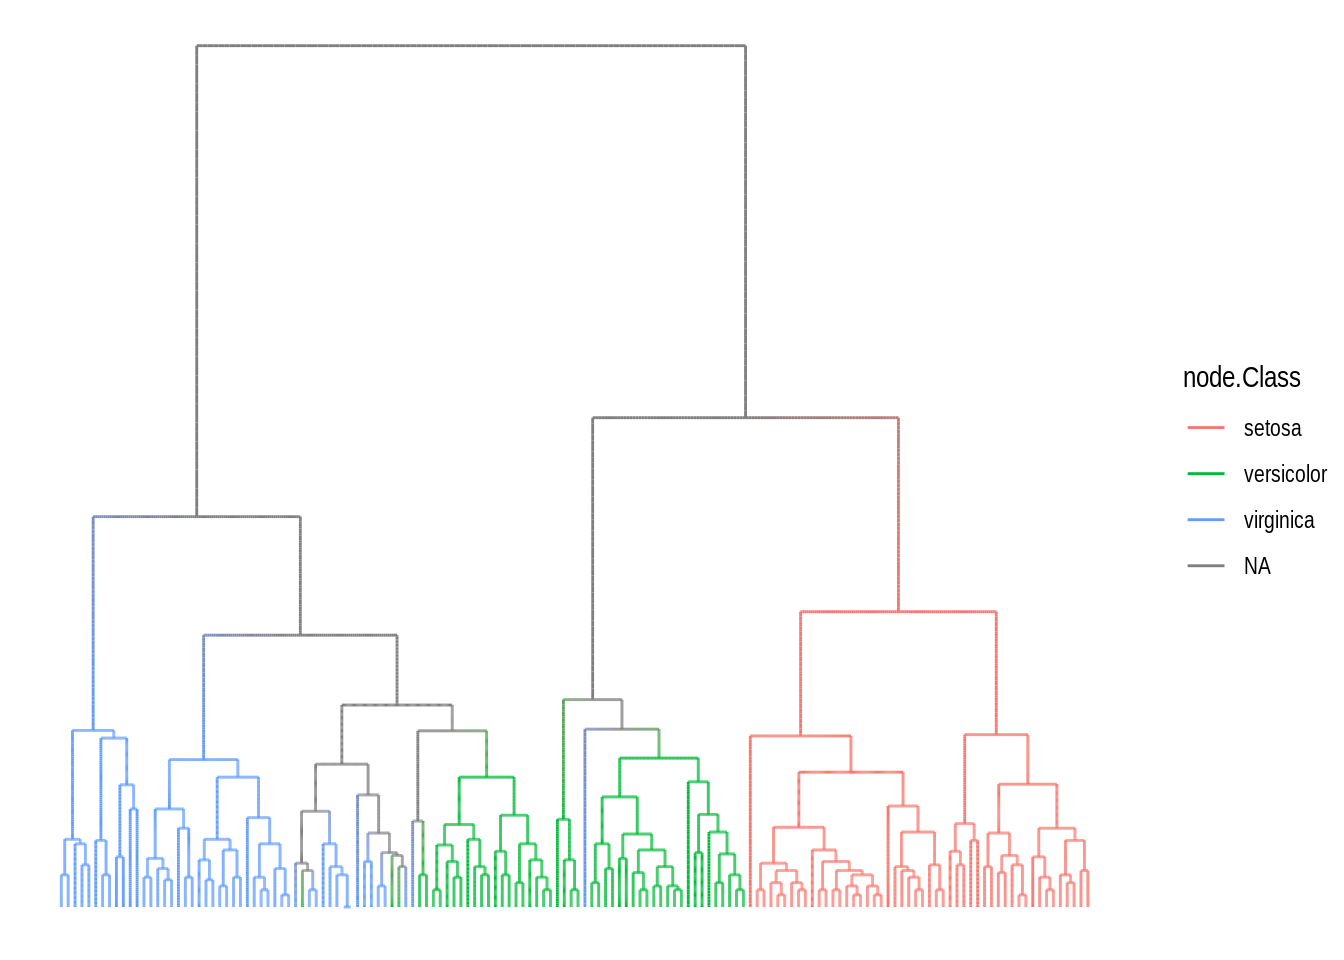
Here is how I got edges colored in a dendrogram with ggraph. Use “node.” in front of the node data column you want.

random-code-snippets
visualization
graphing
dendrogram
Author

Robert M Flight

Published

August 3, 2021

I wanted to color the dendrogram edges according to their class in ggraph, and I was getting stuck because of something that isn’t explicitly mentioned in the documentation, but is implied. You must use “node.” to access the data from the Node Data in the call to aes(...).

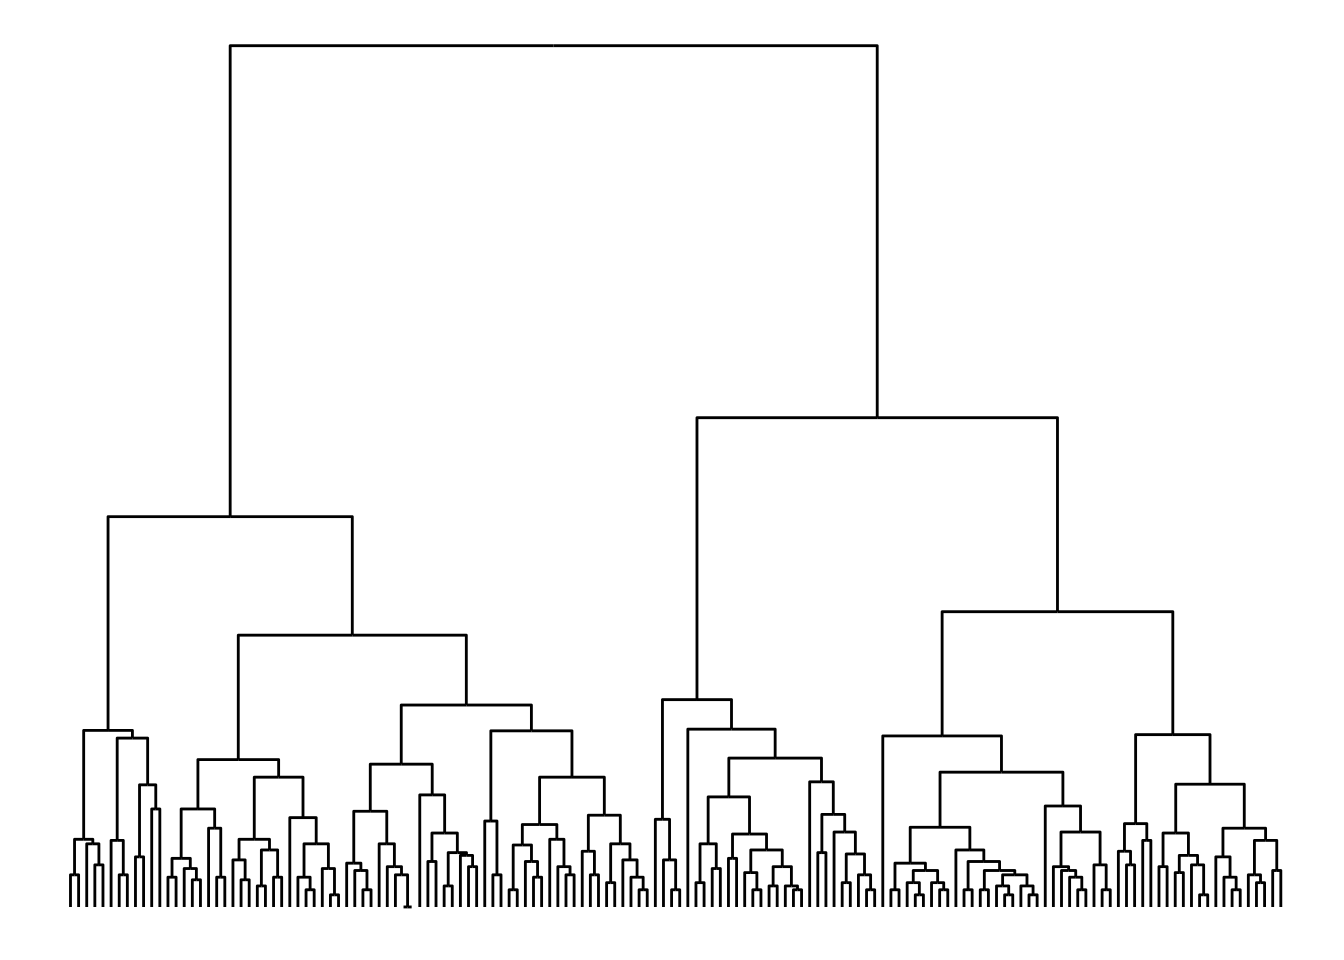
Lets set it up. We will borrow from the “Edges” vignette in the ggraph package (Pederson 2021).

library(ggraph)
Loading required package: ggplot2
library(tidygraph)

Attaching package: 'tidygraph'
The following object is masked from 'package:stats':

    filter
library(purrr)
library(rlang)

Attaching package: 'rlang'
The following objects are masked from 'package:purrr':

    %@%, as_function, flatten, flatten_chr, flatten_dbl, flatten_int,
    flatten_lgl, flatten_raw, invoke, splice
set_graph_style(plot_margin = margin(1,1,1,1))
hierarchy <- as_tbl_graph(hclust(dist(iris[, 1:4]))) %>% 
  mutate(Class = map_bfs_back_chr(node_is_root(), .f = function(node, path, ...) {
    if (leaf[node]) {
      as.character(iris$Species[as.integer(label[node])])
    } else {
      species <- unique(unlist(path$result))
      if (length(species) == 1) {
        species
      } else {
        NA_character_
      }
    }
  }))

hierarchy
# A tbl_graph: 299 nodes and 298 edges
#
# A rooted tree
#
# Node Data: 299 × 5 (active)
  height leaf  label members Class    
   <dbl> <lgl> <chr>   <int> <chr>    
1  0     TRUE  "108"       1 virginica
2  0     TRUE  "131"       1 virginica
3  0.265 FALSE ""          2 virginica
4  0     TRUE  "103"       1 virginica
5  0     TRUE  "126"       1 virginica
6  0     TRUE  "130"       1 virginica
# … with 293 more rows
#
# Edge Data: 298 × 2
   from    to
  <int> <int>
1     3     1
2     3     2
3     7     5
# … with 295 more rows

And with this, we can create a dendrogram.

ggraph(hierarchy, "dendrogram", height = height) +
  geom_edge_elbow()
Warning: Using the `size` aesthetic in this geom was deprecated in ggplot2 3.4.0.
ℹ Please use `linewidth` in the `default_aes` field and elsewhere instead.

Nice! But what if we want the leaves colored by which “Class” they belong to?

ggraph(hierarchy, "dendrogram", height = height) +
  geom_edge_elbow2(aes(color = node.Class))

Note the differences in this function call compared to the previous:

  1. Using geom_edge_elbow2 instead of geom_edge_elbow
  2. Using node.Class, not just Class.

The second point is really important! When you look at the hierarchy object printed above, the Class bit is part of the Node Data, which gets identified by ggraph by the prefix “node.”.

If we don’t use node.Class, here is the error:

ggraph(hierarchy, "dendrogram", height = height) +
  geom_edge_elbow2(aes(color = Class))
Error in `geom_edge_elbow2()`:
! Problem while computing aesthetics.
ℹ Error occurred in the 1st layer.
Caused by error in `FUN()`:
! object 'Class' not found

References

Reuse

Citation

BibTeX citation:
@online{mflight2021,
  author = {Robert M Flight},
  title = {Coloring {Dendrogram} {Edges} with Ggraph},
  date = {2021-08-03},
  url = {https://rmflight.github.io/posts/2021-08-03-coloring-dendrogram-edges-with-ggraph},
  langid = {en}
}
For attribution, please cite this work as:
Robert M Flight. 2021. “Coloring Dendrogram Edges with Ggraph.” August 3, 2021. https://rmflight.github.io/posts/2021-08-03-coloring-dendrogram-edges-with-ggraph.