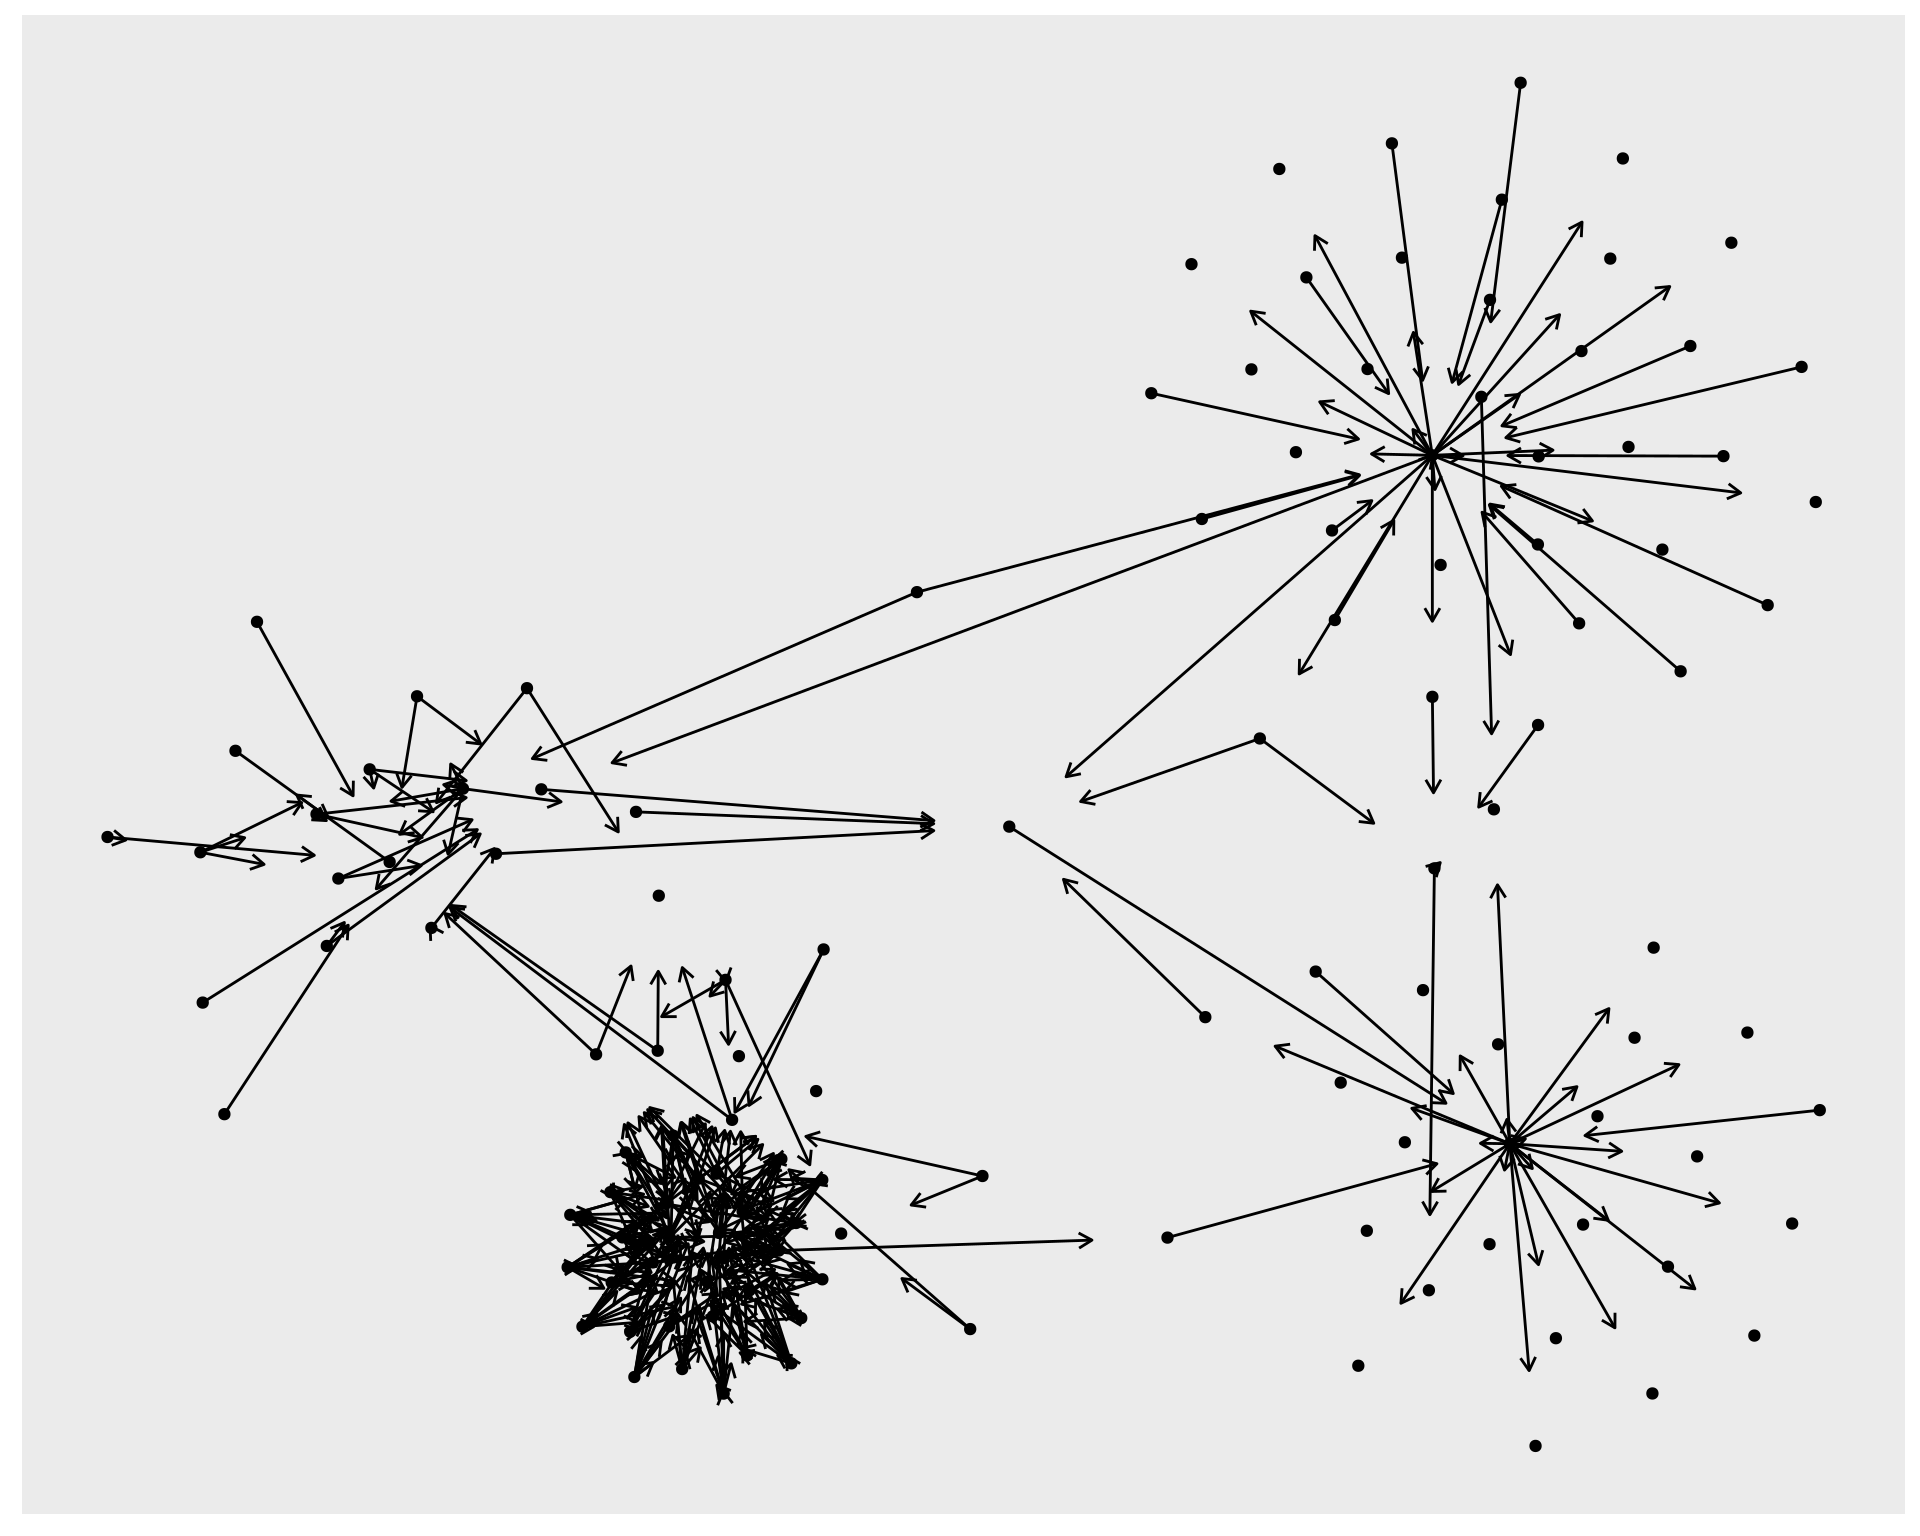
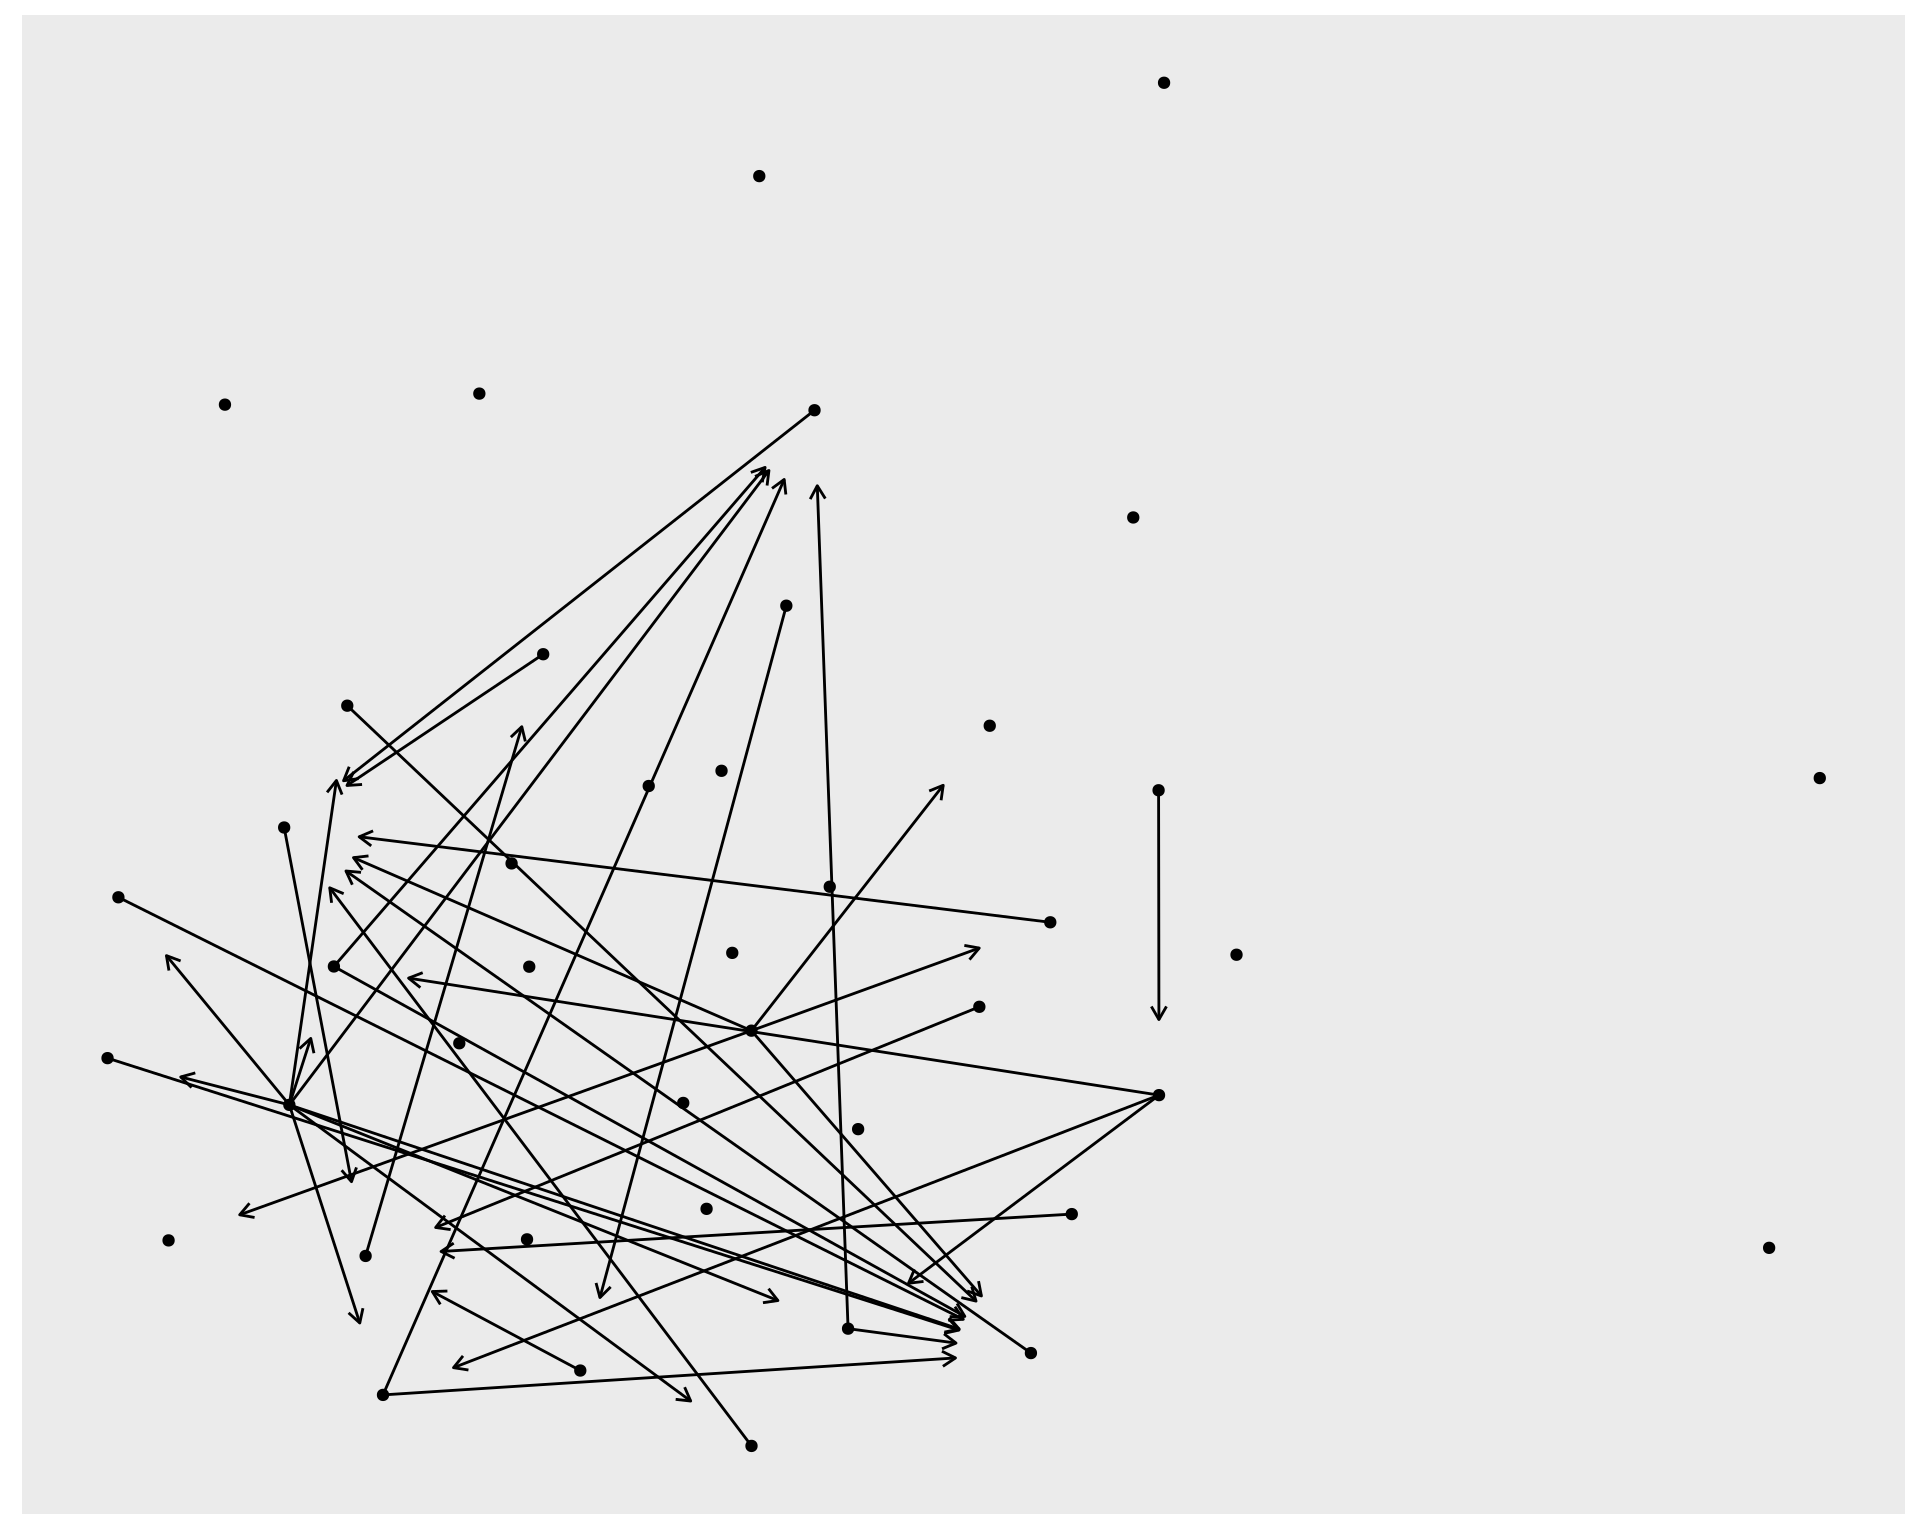
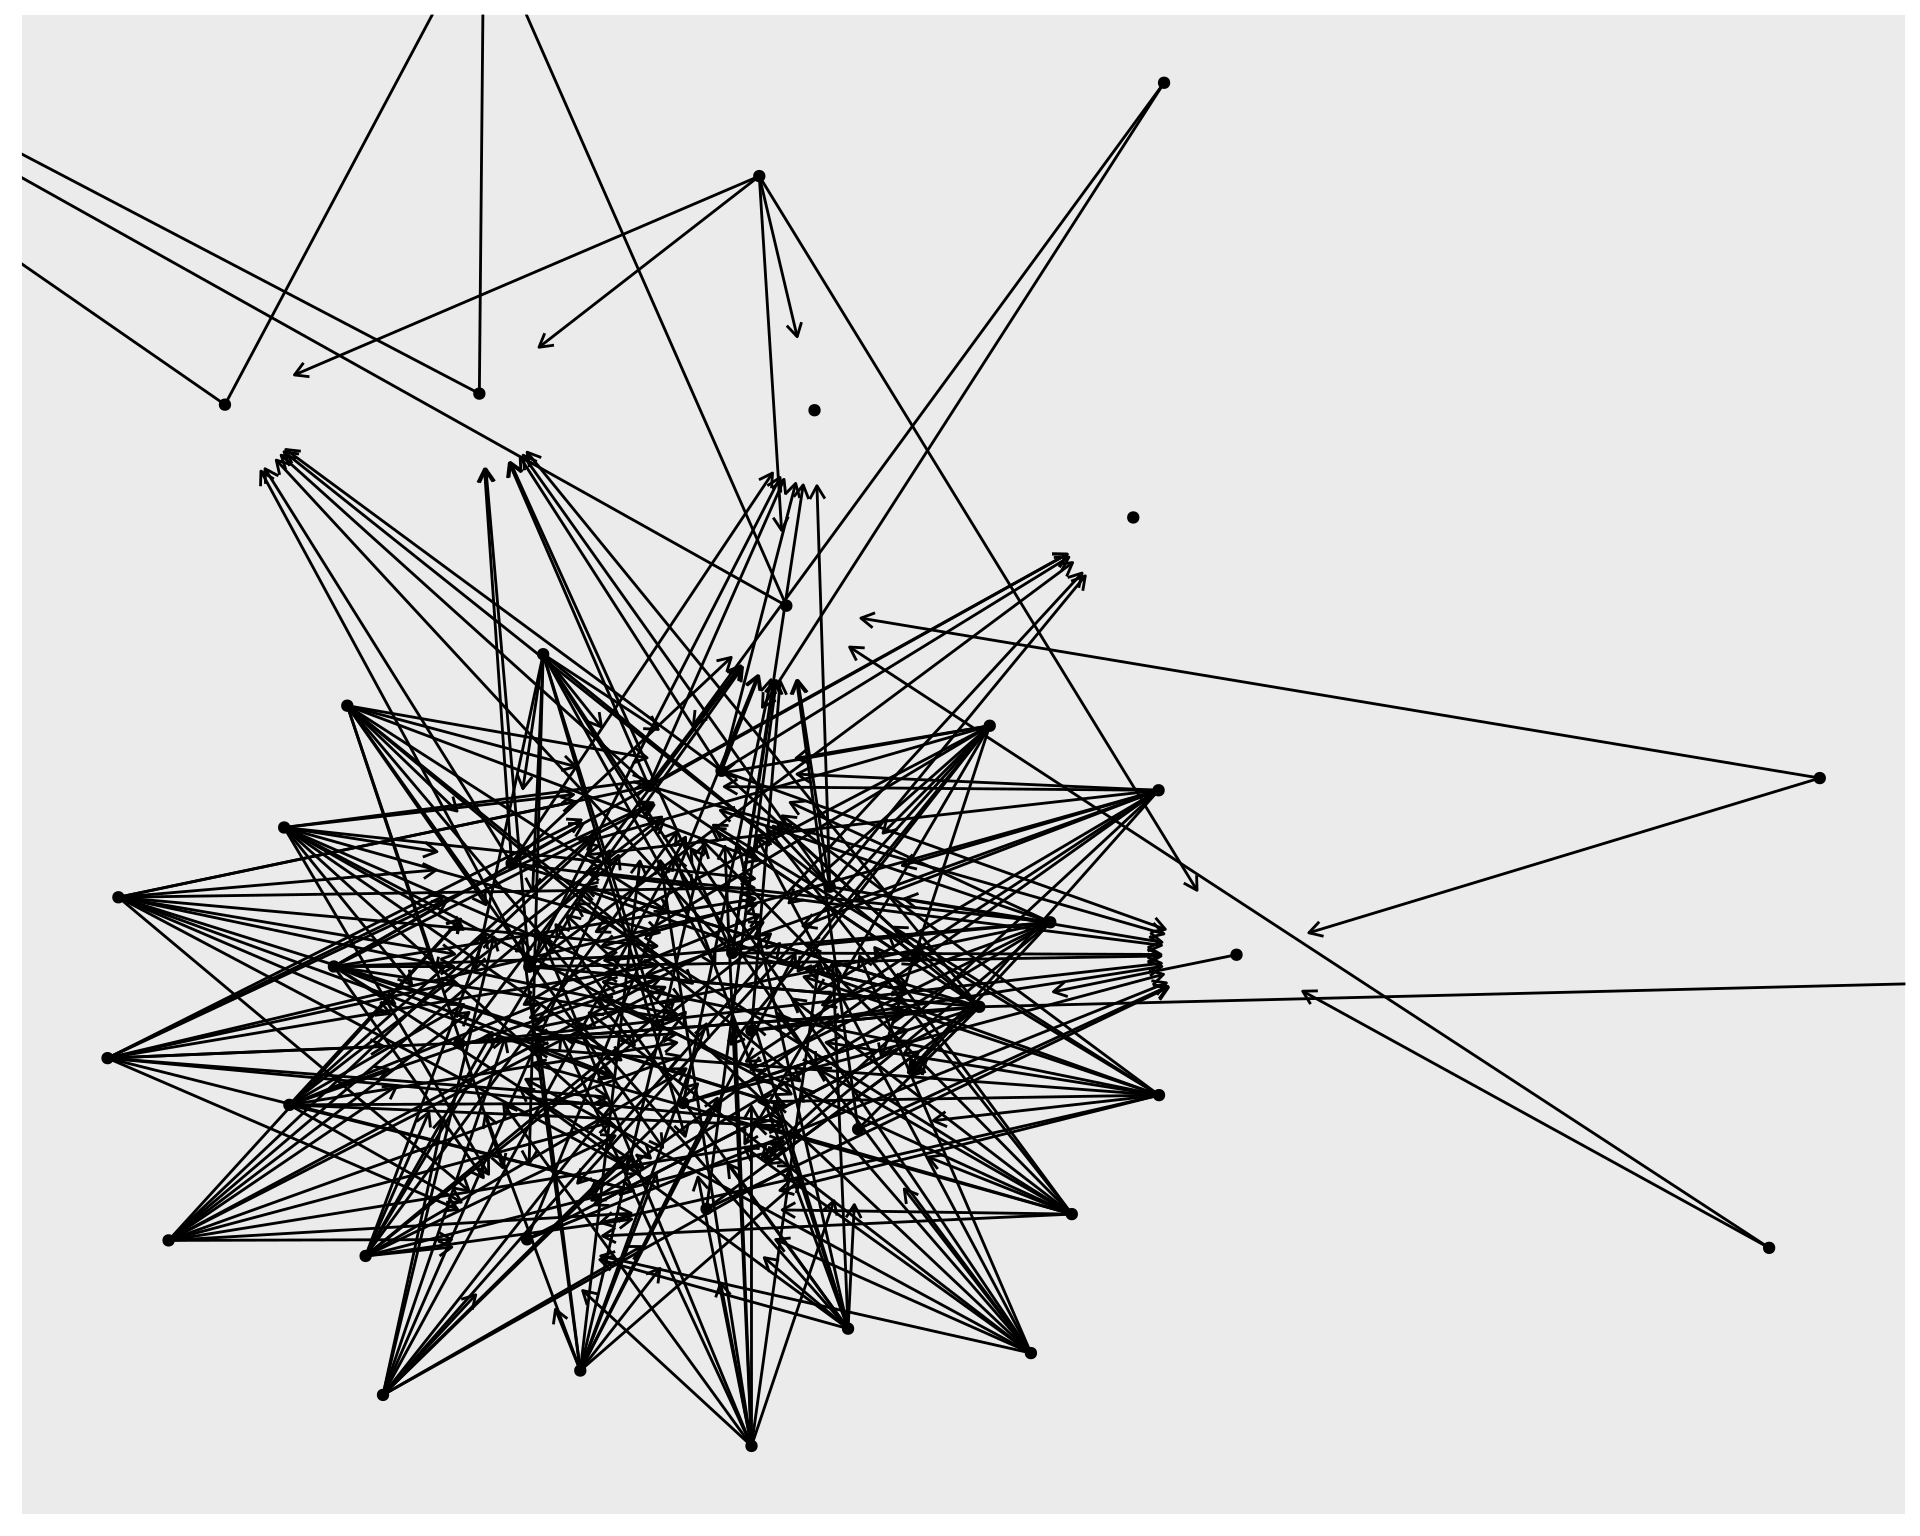
Zooming GGraph Plots

Some code demonstrating how to zoom into portions of a ggraph.

graphing
ggraph
visualization
random-code-snippets
Author

Robert M Flight

Published

November 11, 2021

Inspiration

I was recently working with a largish graph that I am using the ggraph package, and I needed to zoom into a sub-region of the graph.

Setup

knitr::opts_chunk$set(warning = FALSE, message = FALSE, fig.width = 10, fig.height = 8)
example_df = structure(list(from = c(1L, 2L, 3L, 4L, 5L, 6L, 7L, 7L, 7L, 7L, 
                                     7L, 7L, 7L, 7L, 7L, 7L, 8L, 9L, 10L, 11L, 12L, 12L, 12L, 13L, 
                                     13L, 13L, 13L, 13L, 13L, 13L, 14L, 15L, 16L, 16L, 17L, 17L, 18L, 
                                     18L, 19L, 20L, 21L, 21L, 21L, 21L, 21L, 21L, 21L, 21L, 21L, 21L, 
                                     21L, 21L, 22L, 22L, 6L, 23L, 23L, 23L, 23L, 23L, 23L, 23L, 23L, 
                                     23L, 23L, 23L, 23L, 24L, 24L, 24L, 24L, 24L, 24L, 24L, 24L, 24L, 
                                     24L, 24L, 24L, 25L, 25L, 25L, 25L, 25L, 25L, 25L, 25L, 25L, 25L, 
                                     25L, 25L, 26L, 26L, 26L, 26L, 26L, 26L, 26L, 26L, 26L, 26L, 26L, 
                                     26L, 27L, 27L, 27L, 27L, 27L, 27L, 27L, 27L, 27L, 27L, 27L, 27L, 
                                     28L, 28L, 28L, 28L, 28L, 28L, 28L, 28L, 28L, 28L, 28L, 28L, 29L, 
                                     29L, 29L, 29L, 29L, 29L, 29L, 29L, 29L, 29L, 29L, 29L, 30L, 30L, 
                                     30L, 30L, 30L, 30L, 30L, 30L, 30L, 30L, 30L, 30L, 31L, 31L, 31L, 
                                     31L, 31L, 31L, 31L, 31L, 31L, 31L, 31L, 31L, 32L, 32L, 32L, 32L, 
                                     32L, 32L, 32L, 32L, 32L, 32L, 32L, 32L, 33L, 33L, 33L, 33L, 33L, 
                                     33L, 33L, 33L, 33L, 33L, 33L, 33L, 34L, 34L, 34L, 34L, 34L, 34L, 
                                     34L, 34L, 34L, 34L, 34L, 34L, 35L, 35L, 35L, 35L, 35L, 35L, 35L, 
                                     35L, 35L, 35L, 35L, 35L, 36L, 36L, 36L, 36L, 36L, 36L, 36L, 36L, 
                                     36L, 36L, 36L, 36L, 37L, 37L, 37L, 37L, 37L, 37L, 37L, 37L, 37L, 
                                     37L, 37L, 37L, 38L, 38L, 38L, 38L, 38L, 38L, 38L, 38L, 38L, 38L, 
                                     38L, 38L, 39L, 39L, 39L, 39L, 39L, 39L, 39L, 39L, 39L, 39L, 39L, 
                                     39L, 40L, 40L, 40L, 40L, 40L, 40L, 40L, 40L, 40L, 40L, 40L, 40L, 
                                     41L, 41L, 41L, 41L, 41L, 41L, 41L, 41L, 41L, 41L, 41L, 41L, 42L, 
                                     22L, 22L, 22L, 22L, 22L, 22L, 22L, 22L, 22L, 22L, 22L, 22L, 22L, 
                                     22L, 22L, 22L, 22L, 43L, 43L, 44L, 44L, 45L, 45L, 46L, 46L, 47L, 
                                     47L, 48L, 48L, 49L, 49L, 50L, 50L, 51L, 52L, 52L, 53L, 53L, 54L, 
                                     54L, 55L, 55L, 56L, 57L, 57L, 58L, 58L, 59L, 60L, 61L, 61L, 62L, 
                                     16L, 17L, 18L, 63L, 64L, 65L, 66L, 67L, 68L, 69L, 70L, 71L, 72L, 
                                     73L, 74L, 75L, 76L, 20L, 77L, 77L, 78L, 79L, 79L, 80L, 81L, 82L, 
                                     7L, 7L, 7L, 7L, 7L, 7L, 7L, 7L, 7L, 7L, 14L, 15L, 19L, 21L, 21L, 
                                     22L, 83L, 84L, 45L, 46L, 47L, 49L, 50L, 51L, 52L, 53L, 54L, 55L, 
                                     56L, 57L, 58L, 59L, 85L, 48L, 48L, 48L, 48L, 48L, 46L, 46L, 46L, 
                                     46L, 86L, 86L, 13L, 13L, 22L, 7L, 55L, 55L, 55L, 55L, 55L, 51L, 
                                     51L, 51L, 58L, 58L, 58L, 58L, 53L, 53L, 53L, 53L, 49L, 49L, 49L, 
                                     49L, 87L, 87L), to = c(7L, 7L, 7L, 61L, 61L, 61L, 8L, 88L, 89L, 
                                                            90L, 91L, 92L, 93L, 94L, 95L, 96L, 9L, 7L, 9L, 9L, 16L, 17L, 
                                                            18L, 14L, 15L, 16L, 17L, 18L, 19L, 10L, 10L, 10L, 10L, 42L, 10L, 
                                                            42L, 10L, 42L, 10L, 12L, 45L, 46L, 47L, 48L, 49L, 50L, 52L, 53L, 
                                                            54L, 55L, 57L, 58L, 6L, 9L, 9L, 45L, 46L, 47L, 48L, 49L, 50L, 
                                                            52L, 53L, 54L, 55L, 57L, 58L, 45L, 46L, 47L, 48L, 49L, 50L, 52L, 
                                                            53L, 54L, 55L, 57L, 58L, 45L, 46L, 47L, 48L, 49L, 50L, 52L, 53L, 
                                                            54L, 55L, 57L, 58L, 45L, 46L, 47L, 48L, 49L, 50L, 52L, 53L, 54L, 
                                                            55L, 57L, 58L, 45L, 46L, 47L, 48L, 49L, 50L, 52L, 53L, 54L, 55L, 
                                                            57L, 58L, 45L, 46L, 47L, 48L, 49L, 50L, 52L, 53L, 54L, 55L, 57L, 
                                                            58L, 45L, 46L, 47L, 48L, 49L, 50L, 52L, 53L, 54L, 55L, 57L, 58L, 
                                                            45L, 46L, 47L, 48L, 49L, 50L, 52L, 53L, 54L, 55L, 57L, 58L, 45L, 
                                                            46L, 47L, 48L, 49L, 50L, 52L, 53L, 54L, 55L, 57L, 58L, 45L, 46L, 
                                                            47L, 48L, 49L, 50L, 52L, 53L, 54L, 55L, 57L, 58L, 45L, 46L, 47L, 
                                                            48L, 49L, 50L, 52L, 53L, 54L, 55L, 57L, 58L, 45L, 46L, 47L, 48L, 
                                                            49L, 50L, 52L, 53L, 54L, 55L, 57L, 58L, 45L, 46L, 47L, 48L, 49L, 
                                                            50L, 52L, 53L, 54L, 55L, 57L, 58L, 45L, 46L, 47L, 48L, 49L, 50L, 
                                                            52L, 53L, 54L, 55L, 57L, 58L, 45L, 46L, 47L, 48L, 49L, 50L, 52L, 
                                                            53L, 54L, 55L, 57L, 58L, 45L, 46L, 47L, 48L, 49L, 50L, 52L, 53L, 
                                                            54L, 55L, 57L, 58L, 45L, 46L, 47L, 48L, 49L, 50L, 52L, 53L, 54L, 
                                                            55L, 57L, 58L, 45L, 46L, 47L, 48L, 49L, 50L, 52L, 53L, 54L, 55L, 
                                                            57L, 58L, 45L, 46L, 47L, 48L, 49L, 50L, 52L, 53L, 54L, 55L, 57L, 
                                                            58L, 9L, 97L, 98L, 99L, 100L, 101L, 4L, 5L, 102L, 10L, 103L, 
                                                            104L, 105L, 60L, 106L, 107L, 108L, 109L, 13L, 22L, 110L, 83L, 
                                                            21L, 44L, 21L, 44L, 21L, 44L, 21L, 44L, 21L, 44L, 21L, 44L, 44L, 
                                                            21L, 44L, 21L, 44L, 21L, 44L, 21L, 44L, 44L, 21L, 44L, 21L, 44L, 
                                                            44L, 111L, 111L, 112L, 60L, 83L, 83L, 83L, 22L, 22L, 22L, 22L, 
                                                            22L, 22L, 22L, 22L, 22L, 22L, 22L, 22L, 22L, 83L, 83L, 110L, 
                                                            83L, 83L, 110L, 83L, 83L, 22L, 22L, 113L, 114L, 115L, 116L, 117L, 
                                                            118L, 119L, 120L, 121L, 122L, 83L, 83L, 83L, 86L, 2L, 123L, 78L, 
                                                            21L, 84L, 84L, 84L, 84L, 84L, 84L, 84L, 84L, 84L, 84L, 84L, 84L, 
                                                            84L, 84L, 10L, 79L, 124L, 86L, 125L, 84L, 79L, 124L, 86L, 125L, 
                                                            110L, 83L, 42L, 11L, 126L, 111L, 48L, 79L, 124L, 86L, 125L, 79L, 
                                                            86L, 125L, 79L, 124L, 86L, 125L, 79L, 124L, 86L, 125L, 79L, 124L, 
                                                            86L, 125L, 46L, 48L)), class = "data.frame", row.names = c(NA, 
                                                                                                                       -432L))

library(ggraph)
Loading required package: ggplot2
library(tidygraph)

Attaching package: 'tidygraph'
The following object is masked from 'package:stats':

    filter
library(igraph)

Attaching package: 'igraph'
The following object is masked from 'package:tidygraph':

    groups
The following objects are masked from 'package:stats':

    decompose, spectrum
The following object is masked from 'package:base':

    union
example_graph = as_tbl_graph(example_df)

Initial View

Let’s generate a plot of this to start.

set.seed(1234)
ggraph(example_graph, "graphopt") +
  geom_edge_link(arrow = arrow(length = unit(2, 'mm')),
                end_cap = circle(10, "mm")) +
  geom_node_point()

You can see the bottom left section of this graph looks like a mess. It sure would be awesome if we could zoom into that region, and replot it.

Find Those Nodes

We will use igraphs community detection to break this into community sets and select the correct group.

walk_membership = cluster_walktrap(example_graph)
walk_communities = membership(walk_membership)
split_comms = split(names(walk_communities), walk_communities)
names(split_comms) = NULL

which_comm = split_comms[[which(purrr::map_lgl(split_comms, ~ "58" %in% .x))]]

Initial Layout

One way to make sure we can get the same layout is to create the layout, which is treated as a graph by ggraph.

# we set the seed so its the same layout as previous
set.seed(1234)
example_layout = create_layout(example_graph, "graphopt")

ggraph(example_layout) +
  geom_edge_link(arrow = arrow(length = unit(2, 'mm')),
                end_cap = circle(10, "mm")) +
  geom_node_point()

Awesome, looks the same as the previous.

Subset Nodes and Get Range

sub_layout = example_layout %>%
  dplyr::filter(name %in% which_comm)
sub_xlim = range(sub_layout$x)
sub_ylim = range(sub_layout$y)

Plot Subset

We would think we should be able to just use the sub-layout to plot the subset of nodes. Lets try that first.

ggraph(sub_layout) +
  geom_edge_link(arrow = arrow(length = unit(2, 'mm')),
                end_cap = circle(10, "mm")) +
  geom_node_point()

As we can see, this isn’t quite right. We are missing some of the edges.

Plot Using Subset Ranges

ggraph(example_layout) +
  geom_edge_link(arrow = arrow(length = unit(2, 'mm')),
                end_cap = circle(10, "mm")) +
  geom_node_point() +
  coord_cartesian(xlim = sub_xlim, ylim = sub_ylim)

Finally! This is what we wanted. And we can see why it’s so overlapped in the full plot! It’s pretty much a hairball in that part of the graph.

Reuse

Citation

BibTeX citation:
@online{mflight2021,
  author = {Robert M Flight},
  title = {Zooming {GGraph} {Plots}},
  date = {2021-11-11},
  url = {https://rmflight.github.io/posts/2021-11-11-zooming-ggraph-plots},
  langid = {en}
}
For attribution, please cite this work as:
Robert M Flight. 2021. “Zooming GGraph Plots.” November 11, 2021. https://rmflight.github.io/posts/2021-11-11-zooming-ggraph-plots.