
TL;DR
Journal impact factor distributions seem to be log-normal. If we decide they should be used, then at the very least, they should be log-transformed before doing any calculations with them.
Journal Impact Factor
At some point in history, someone decided that we could measure how important a journal is by the number of citations the manuscripts within it get. Of course this is ridiculous on it’s face, but over time those journals with higher impact factors have become more important and prestigous to publish in. In fact, instead of judging each others work on the publications themselves, academia started doing this thing where we instead judge papers (and academics) by where they are published and the publications journal impact factors (JIF). Most publishers make a big deal out of announcing their journals JIF and report them to the 3rd decimal place. Stupid, I know, but here we are. Even more ridiculous, Thomson Reuters makes big money counting all of these citations, calculating the JIF and selling the data to others.
Larivi{`e}re et al
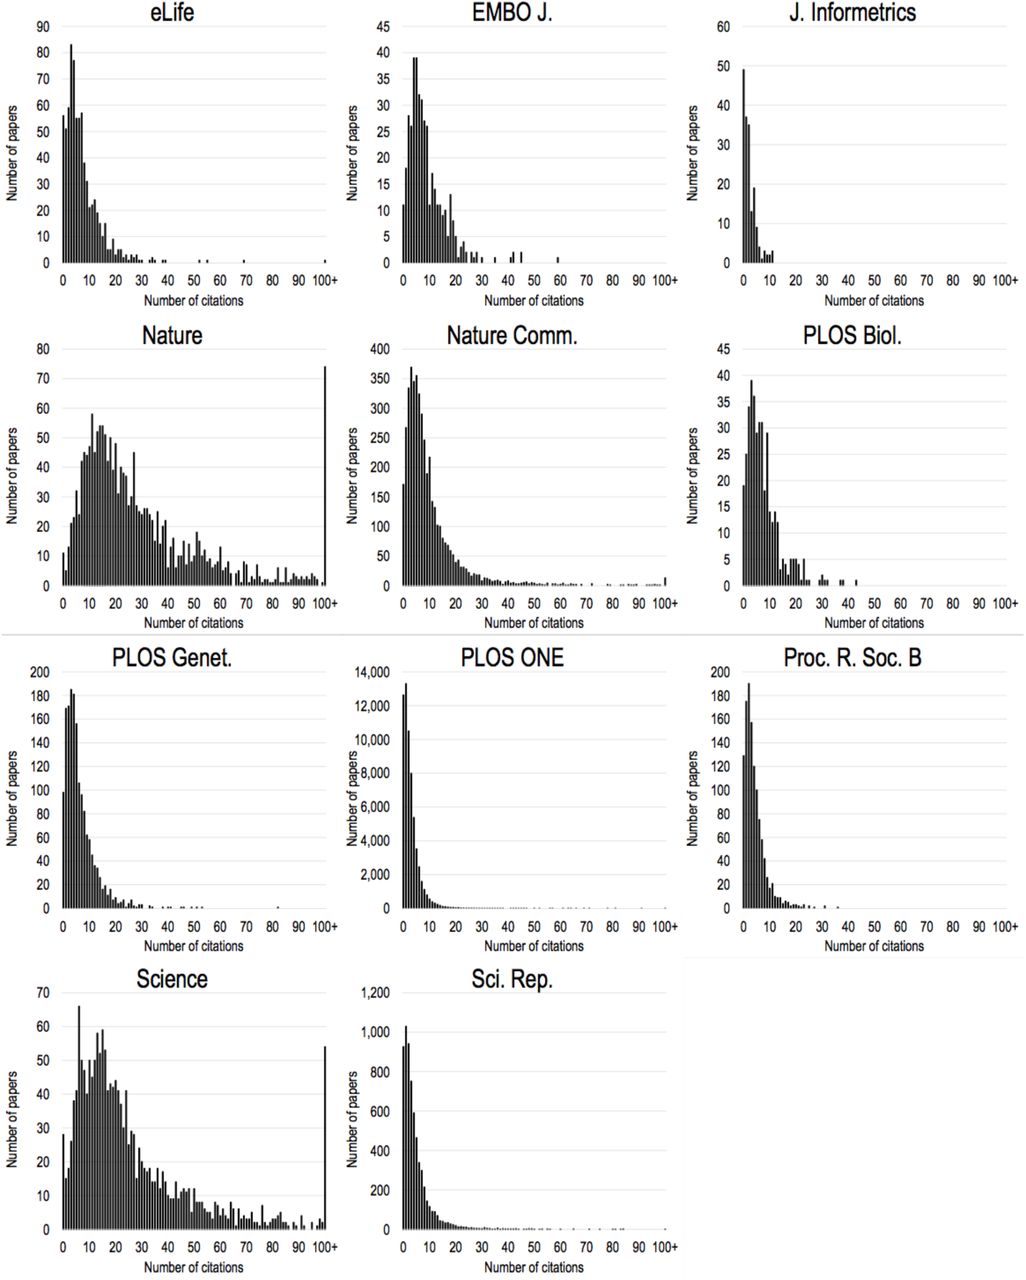
Way back in 2016, Larivi`ere et al published a nice paper on the distributions of journal impact factors and how to compare them (Larivière et al. 2016). I heartily recommend you check that publication out. I’m not going to discuss this manuscript in particular, except to note two things:
- that they provided a very nice description of how to acquire and calculate citation counts from a service such as Thomson Reuters Web of Science.
- when I look at their graphs, I thought they looked likely to be log-normal (see Figure 1).
Getting Data
Unfortunately, Larivi{`e}re et al didn’t provide their data. Which makes sense, it’s from a closed source. However, I used their description of getting the data from Web of Science, and went and created my own version of the data for a set of journals so I could do my own analysis.
Following the guide provided in the Appendix of (Larivière et al. 2016), I went into Web Of Science and produced citation reports for 7 journals (eLife, EMBO Journal, Nature, Nature Communications, PLOS Biology, PLOS Genetics, and Science), and saved them. Unfortunately, the preprint shows data for publications published in 2013-2014, but the guide showed 2012-2013, so I ended up downloading the citation data for publications published in 2012-2013, which would have influenced the 2014 JIF. However, I think the conclusions are the same.
If you want the original data I acquired, you can go check out (Flight 2021).
Raw Plots
So lets load up the data and plot the citation counts for each journal, as shown in Figure 2.
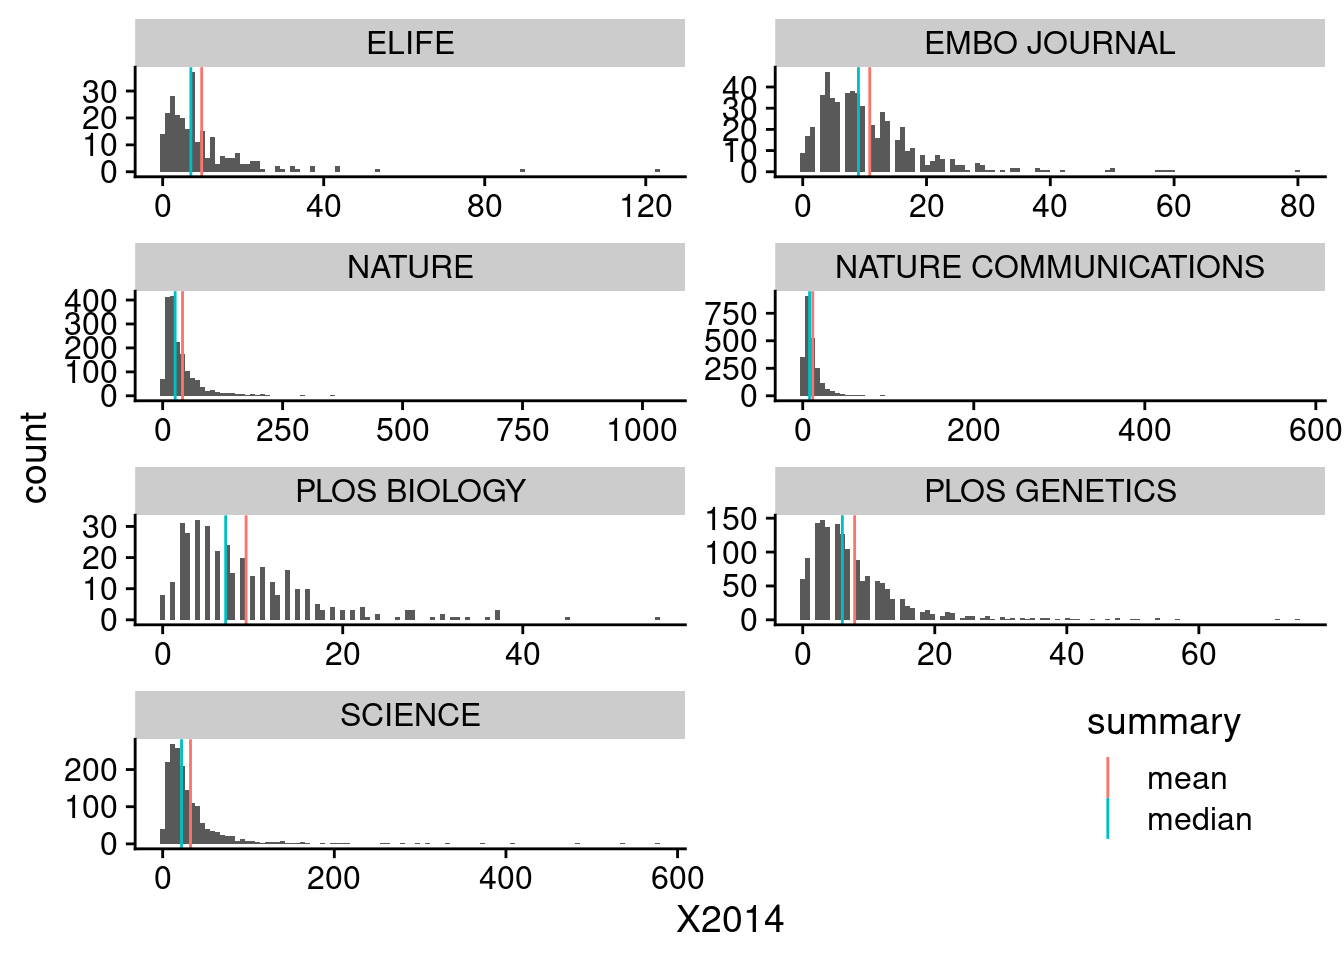
I think these still look pretty similar to those shown in Figure 1. We can see that the means are heavily influenced by the very long tails in these graphs.
Log Transform
Now, lets log-transform them, and calculate summary statistics on the log-transformed data, as shown in Figure 3.
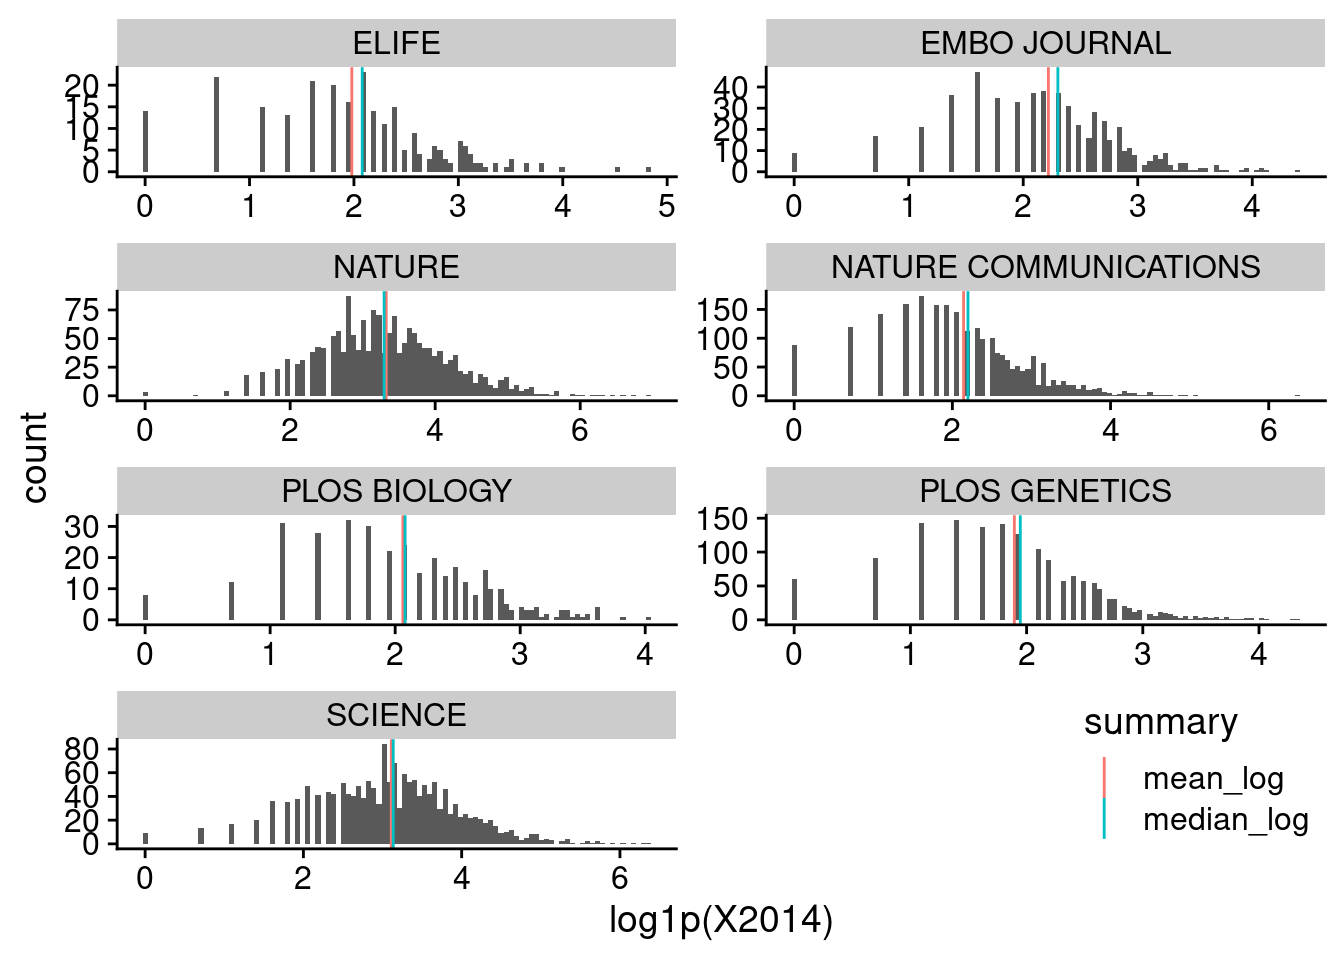
These look much more normal, at least for some of the heavily cited journals like Nature and Science.
So, if we are going to continue using these kinds of metrics, we should either adopt the metrics that Larivi`ere propose, or at the very least log-transform the citation counts.
Or we could drop them altogher.
References
Flight, R. M. 2021. “Curry JIF Analysis.” GitHub Repository. https://github.com/rmflight/curry_jif_paper; GitHub.
Larivière, Vincent, Véronique Kiermer, Catriona J. MacCallum, Marcia McNutt, Mark Patterson, Bernd Pulverer, Sowmya Swaminathan, Stuart Taylor, and Stephen Curry. 2016. “A Simple Proposal for the Publication of Journal Citation Distributions.” bioRxiv. https://doi.org/10.1101/062109.
Reuse
Citation
BibTeX citation:
@online{mflight2022,
  author = {Robert M Flight},
  title = {Journal {Impact} {Factor} {Distributions}},
  date = {2022-12-25},
  url = {https://rmflight.github.io/posts/2022-12-25-journal-impact-factor-distributions},
  langid = {en}
}
For attribution, please cite this work as:
Robert M Flight. 2022. “Journal Impact Factor
Distributions.” December 25, 2022. https://rmflight.github.io/posts/2022-12-25-journal-impact-factor-distributions.