TL; DR
If you have a unimodal distribution of values, you can use R’s density or
Scipy’s gaussian_kde to create density estimates of the data, and then
take the maxima of the density estimate to get the mode. See below for
actual examples in R and Python.
Mode in R
First, lets do this in R. Need some values to work with.
library(ggplot2)
set.seed(1234)
n_point <- 1000
data_df <- data.frame(values = rnorm(n_point))

ggplot(data_df, aes(x = values)) + geom_histogram()
## `stat_bin()` using `bins = 30`. Pick better value with `binwidth`.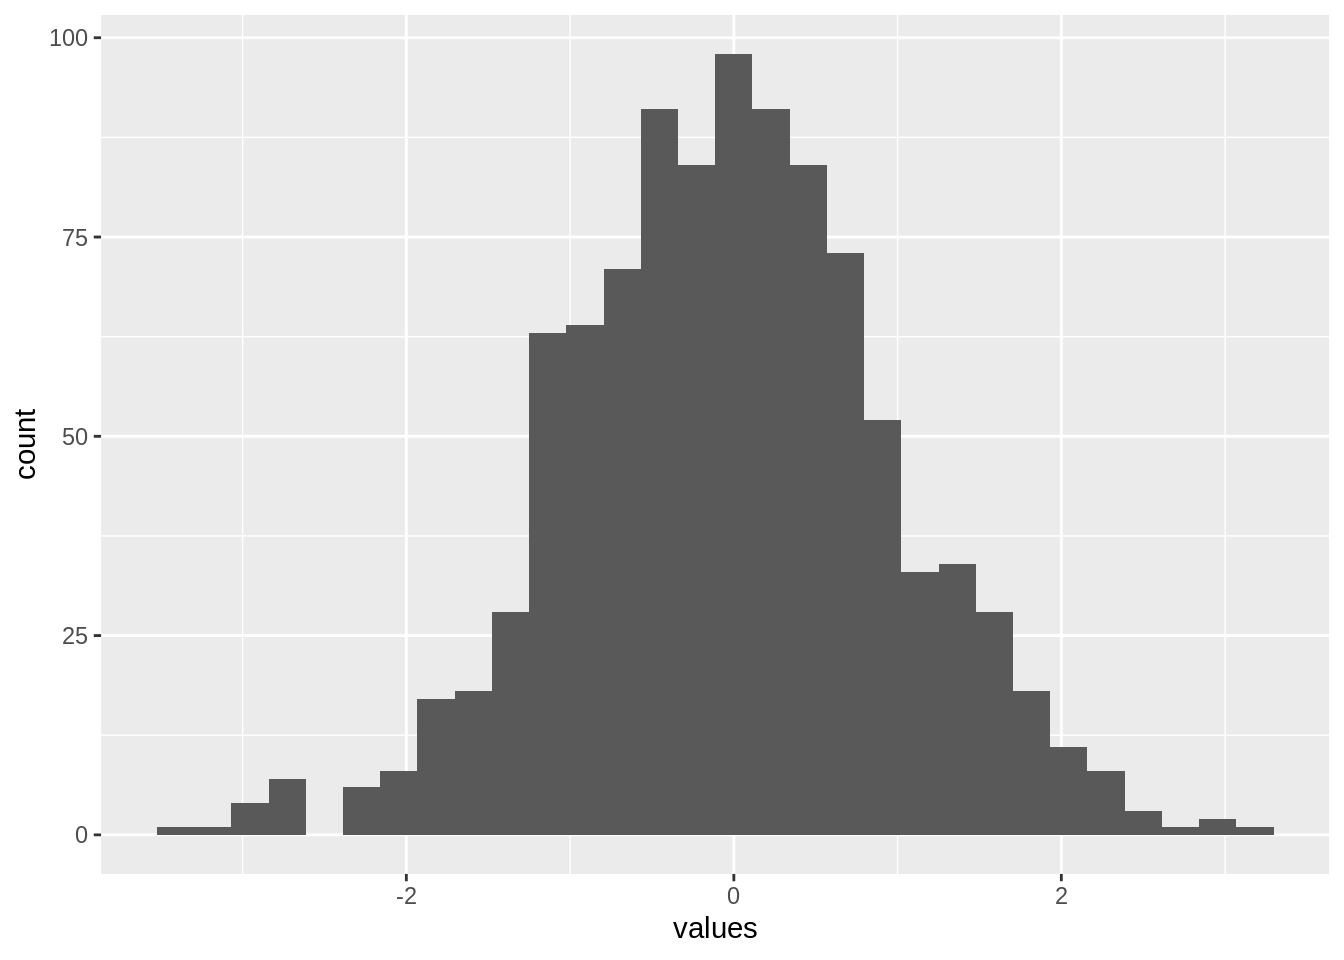
ggplot(data_df, aes(x = values)) + geom_density()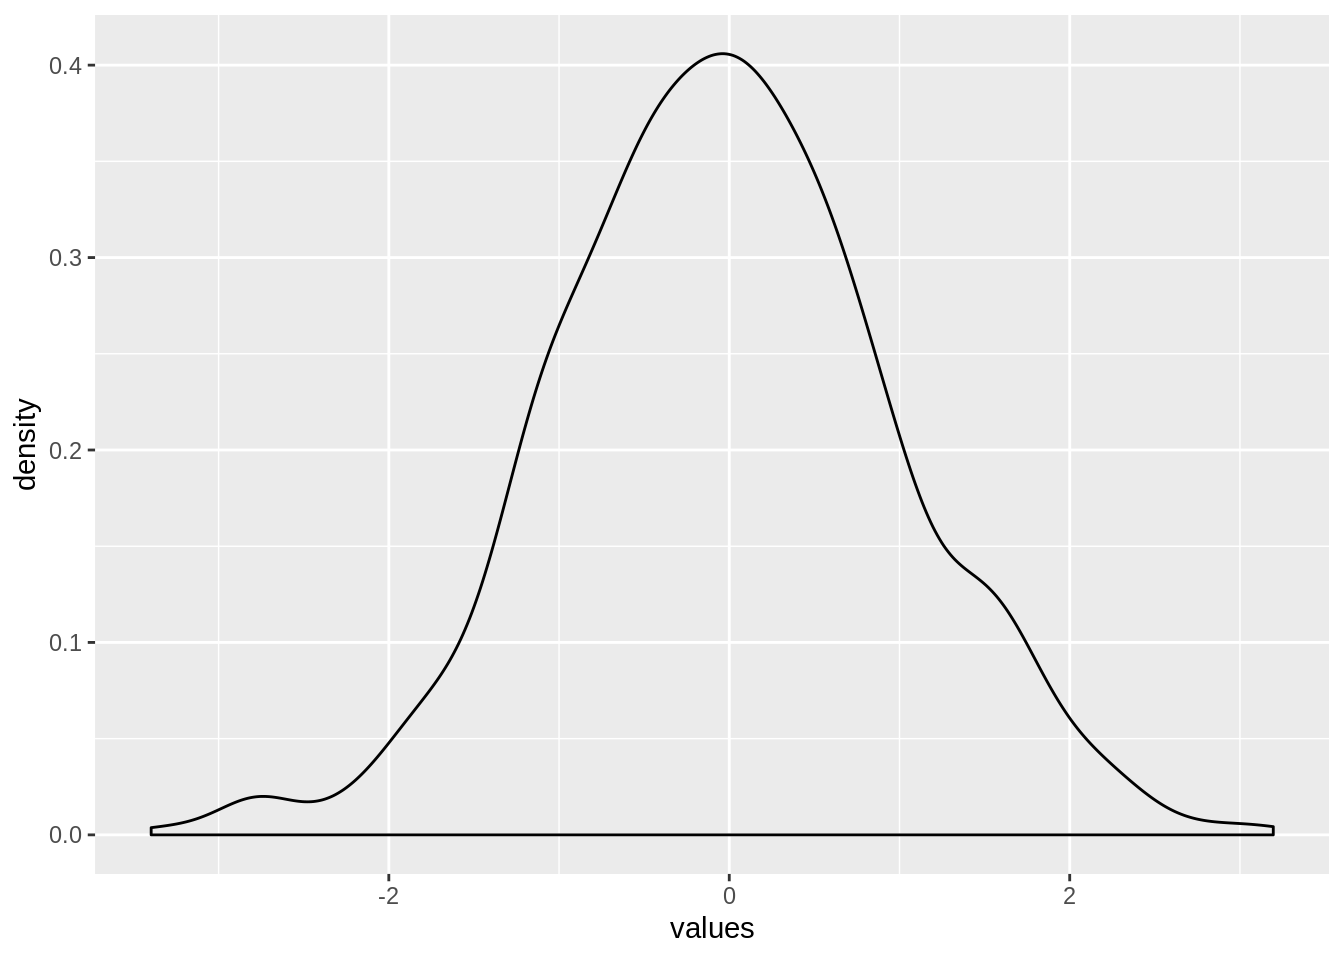
We can do a kernel density, which will return an object with a bunch of peices.
One of these is y, which is the actual density value for each value of x that was used! So
we can find the mode by querying x for the maxima in y!
density_estimate <- density(data_df$values)

mode_value <- density_estimate$x[which.max(density_estimate$y)]
mode_value
## [1] -0.04599328Plot the density estimate with the mode location.
density_df <- data.frame(value = density_estimate$x, density = density_estimate$y)

ggplot(density_df, aes(x = value, y = density)) + geom_line() + geom_vline(xintercept = mode_value, color = "red")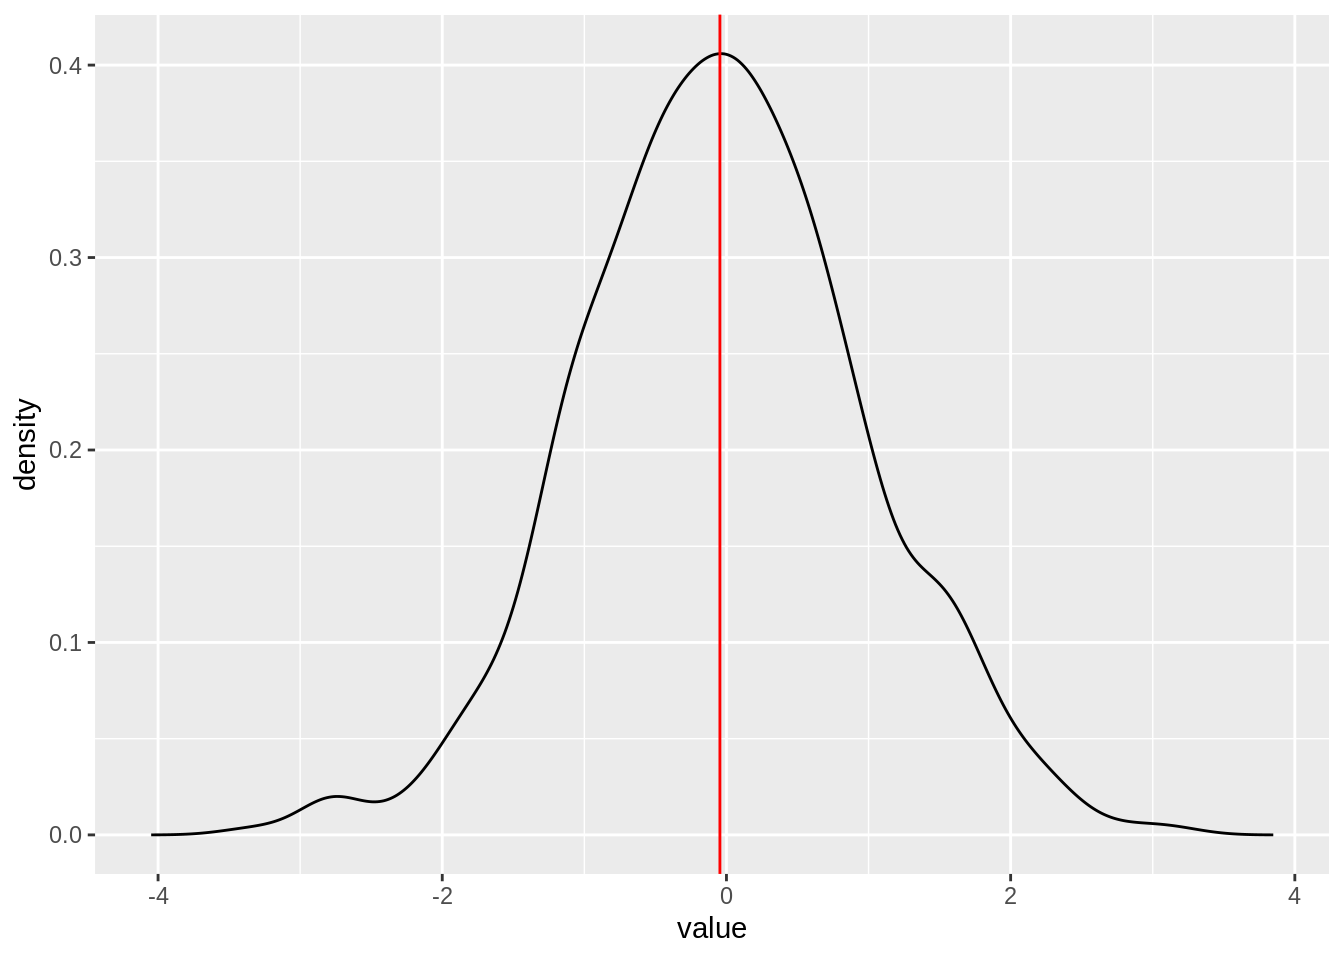
Python
Lets do something similar in Python. Start by generating a set of random values.
import numpy as np
import scipy.stats as stats
import matplotlib.pyplot as plt
values = np.random.normal(size = 1000)
plt.hist(values)
plt.show()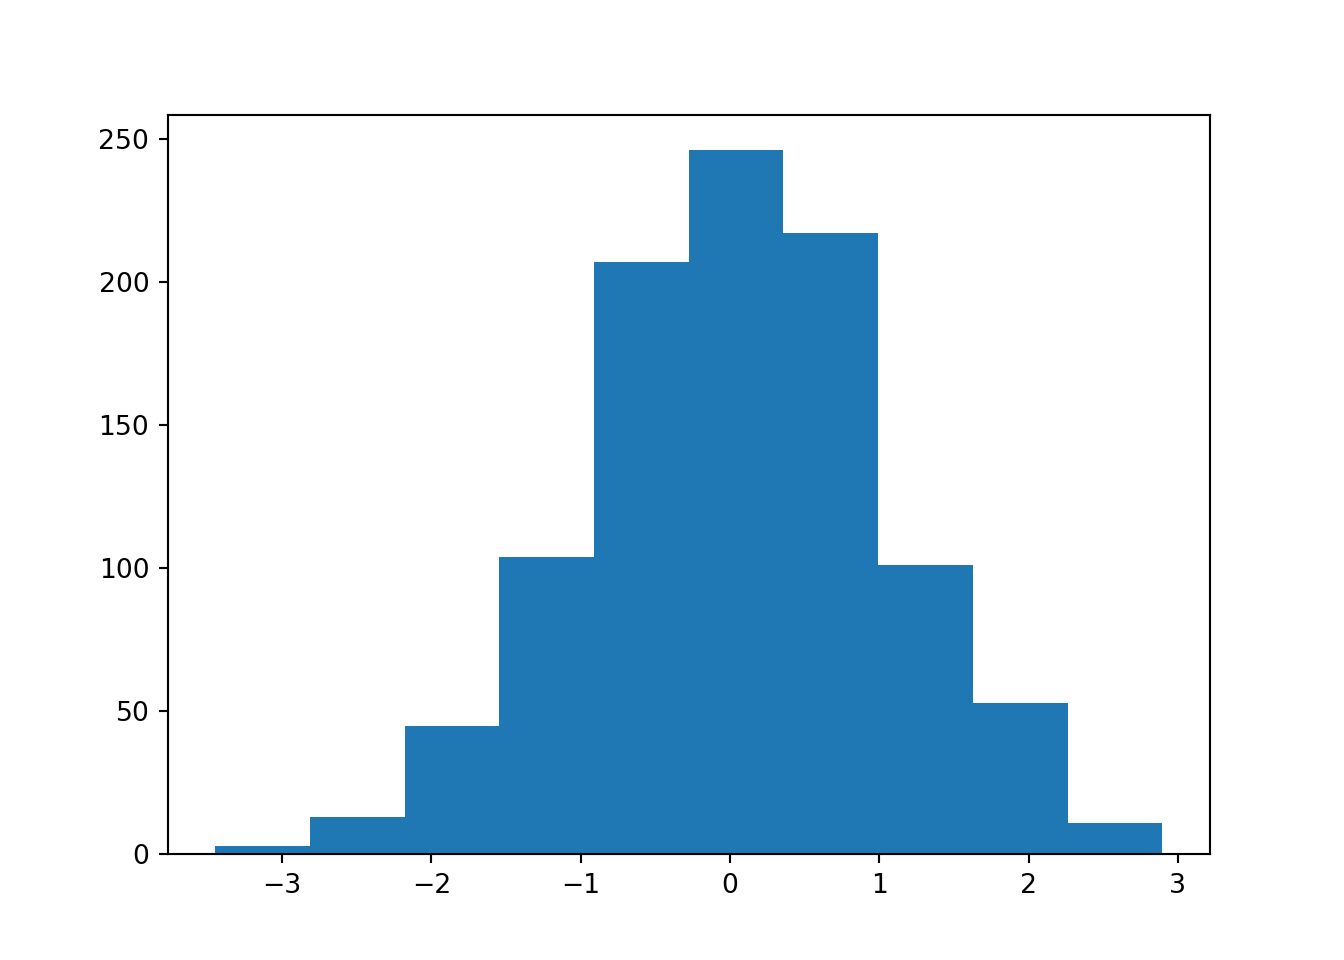
And then use gaussian_kde to get a kernel estimator of the density, and then
call the pdf method on the original values.
kernel = stats.gaussian_kde(values)
height = kernel.pdf(values)
mode_value = values[np.argmax(height)]
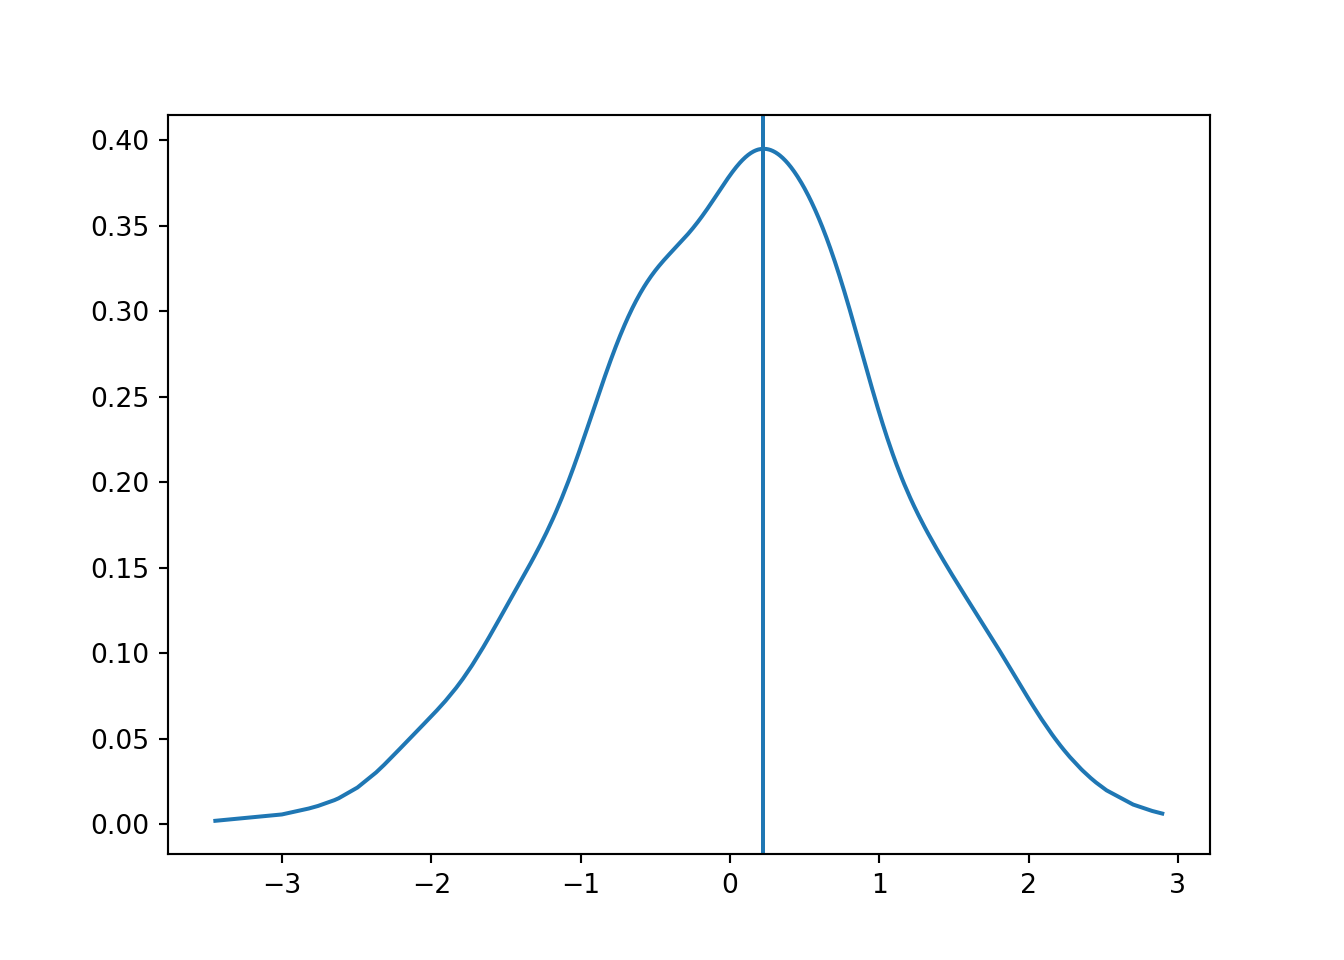
print(mode_value)## 0.22162730158854502Plot to show indeed we have it right. Note we sort the values first so the PDF looks right.
values2 = np.sort(values.copy())
height2 = kernel.pdf(values2)
plt.clf()
plt.cla()
plt.close()
plt.plot(values2, height2)
plt.axvline(mode_value)
plt.show()