I’m currently working on a project where we want to know, based on a euclidian distance measure, what is the probability that the value is a match to the another value. i.e. given an actual value, and a theoretical value from calculation, what is the probability that they are the same? This can be calculated using a chi-square distribution with one degree-of-freedom, easily enough by considering how much of the chi-cdf we are taking up.
pMatch <- 1 - pchisq(distVal, 1)The catch is, we want to do this a whole lot of times, in c++. We could use the boost library to calculate the chi-square each time we need it. Or we could generate a lookup table that is able to find the p-value simply based on the distance. This is especially attractive if we have a limit past which we consider the probability of a match as being zero, and if we use enough decimal points that we don’t suffer too much in precision.
Although our goal is to implement this in c++, I also want to prototype, demonstrate and evaluate the approach in R.
R
Random number set
We are going to consider 25 (5 standard deviations squared) as our cutoff for saying the probability is zero. So to make sure we are doing all calculations using the exact same thing, we will pre-generate the values for testing on real data, in this case a set of 1000000 random numbers from zero to 25.
nPoint <- 1000000
randomData <- abs(rnorm(nPoint, mean=5, sd=5)) # take absolute so we have only positive values
randomData[randomData > 25] <- 25
hist(randomData, 100)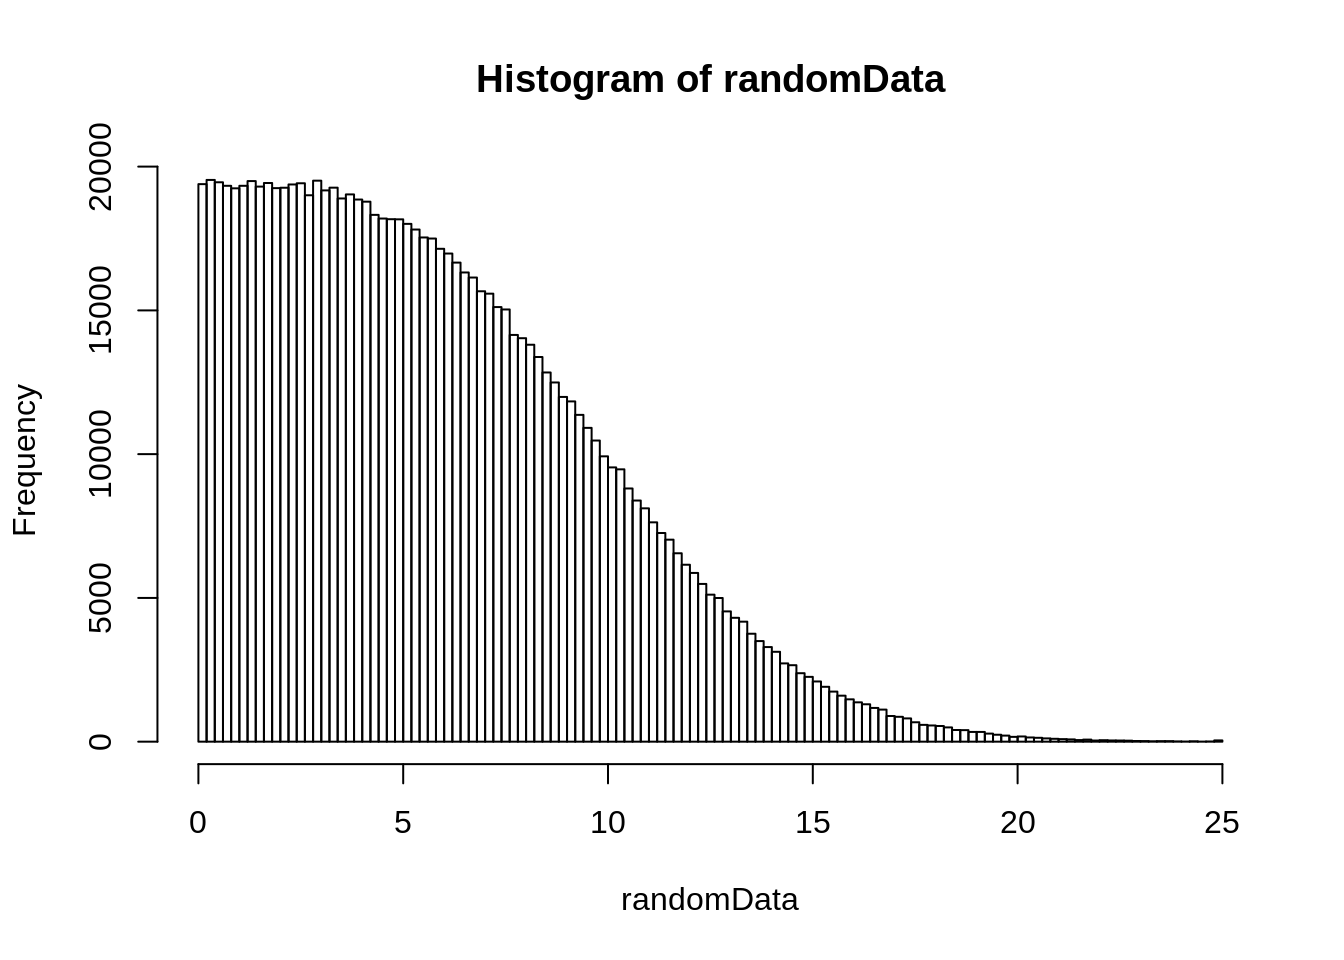
The R way
Of course, the way to calculate p-values for all this data in R is to do the whole vector at once. How long does that take?
bTime <- Sys.time()
actPVals <- 1 - pchisq(randomData, 1)
eTime <- Sys.time()
rwayDiff <- difftime(eTime, bTime)
rwayDiff
## Time difference of 0.3404441 secsNaive way
A naive way to do this is to do it piecemeal, in a for loop. I will pre-allocate the result vector so we don’t take a hit on memory allocation.
naiveRes <- numeric(nPoint)
bTime <- Sys.time()
for (iP in 1:nPoint){
  naiveRes[iP] <- 1 - pchisq(randomData[iP], 1)
}
eTime <- Sys.time()
naiveDiff <- difftime(eTime, bTime)
naiveDiff
## Time difference of 1.340965 secsSo this takes almost 10 times longer. Which of course, is why you are encouraged to do vectorized calculations whenever possible in R, but you already knew that, didn’t you?
Lookup table
What if we now store a set of p-value results in a table, doing it in such a way as to use the actual distance as an index into the table?
nDivision <- 10000
dof <- 1
nSD <- 25

nElements <- nSD * nDivision

chiVals <- seq(0, nElements, 1) / nDivision # the chi-squared values (or distances), also used as indices when multiplied by 10000

pTable <- 1 - pchisq(chiVals, 1) # the actual chi-square p-values for those distances
To find a value, we just multiply the distance by 10000 (the number of divisions), and add 1 (because R uses 1 based indexing instead of zero).
testVal <- sample(chiVals, 1) # grab a value from the chiVals previously generated
pTable[(testVal * nDivision) + 1]
## [1] 5.177707e-061 - pchisq(testVal, 1)## [1] 5.177707e-06How long does this take compared to the other approaches?
tableRes <- numeric(nPoint)
bTime <- Sys.time()
for (iP in 1:nPoint){
  tableRes[iP] <- pTable[(randomData[iP] * nDivision) + 1]
}
eTime <- Sys.time()
tableDiff <- difftime(eTime, bTime)
tableDiff
## Time difference of 0.1184466 secsSo somewhere in-between the two. So not as good as doing a vectorized call, but better than making a call each time. Which is actually what I expected. What about any loss in precision of the values returned?
tableRawPrecision <- abs(tableRes - actPVals) / actPVals * 100

precTable <- data.frame(org=actPVals, table=tableRes, percError=tableRawPrecision)
ggplot(precTable, aes(x=org, y=table)) + geom_point()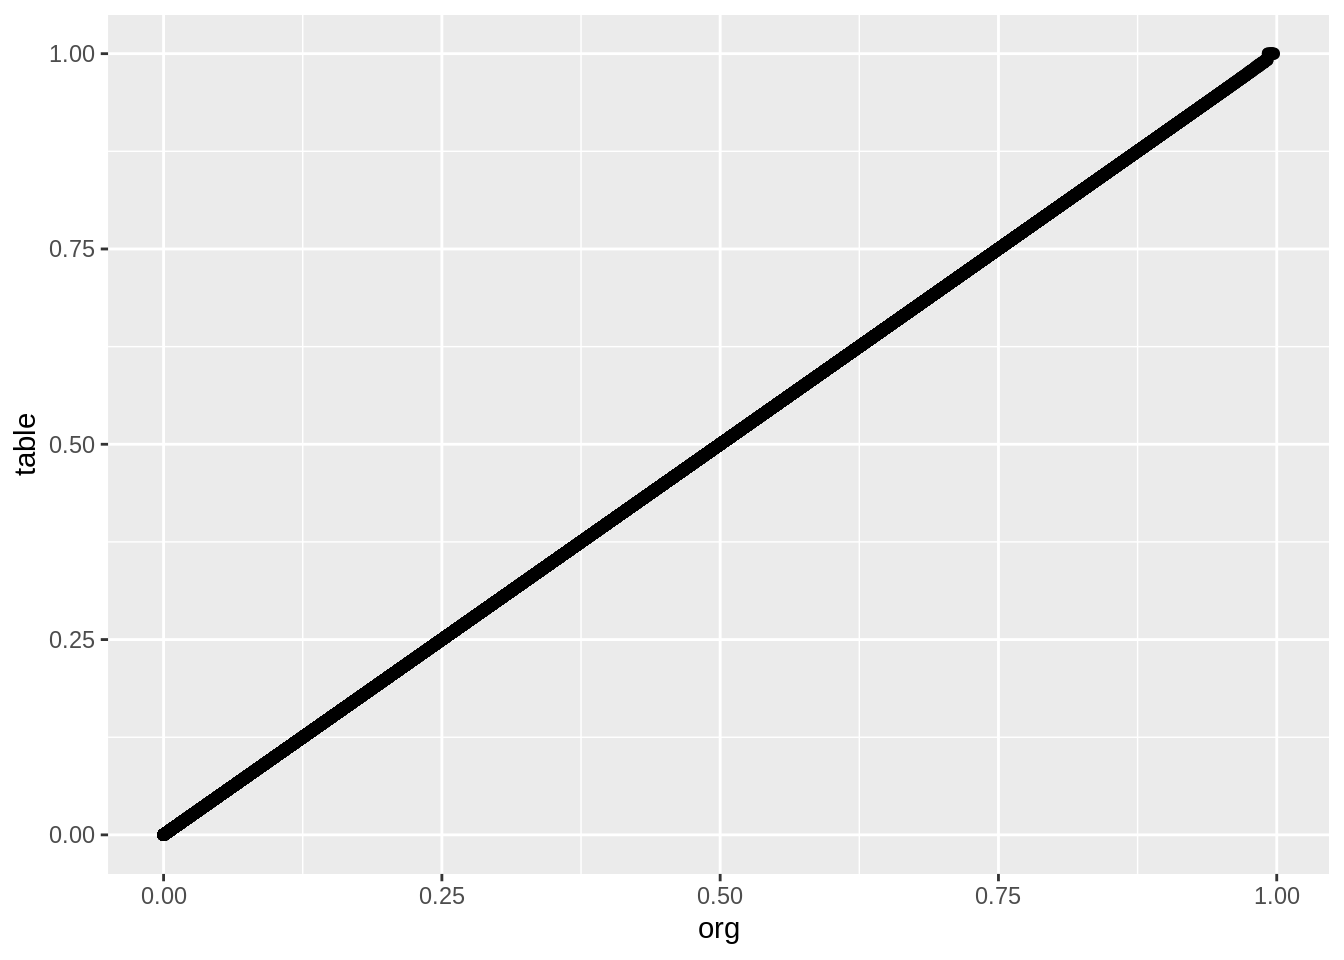
ggplot(precTable, aes(x=org, y=percError)) + geom_point()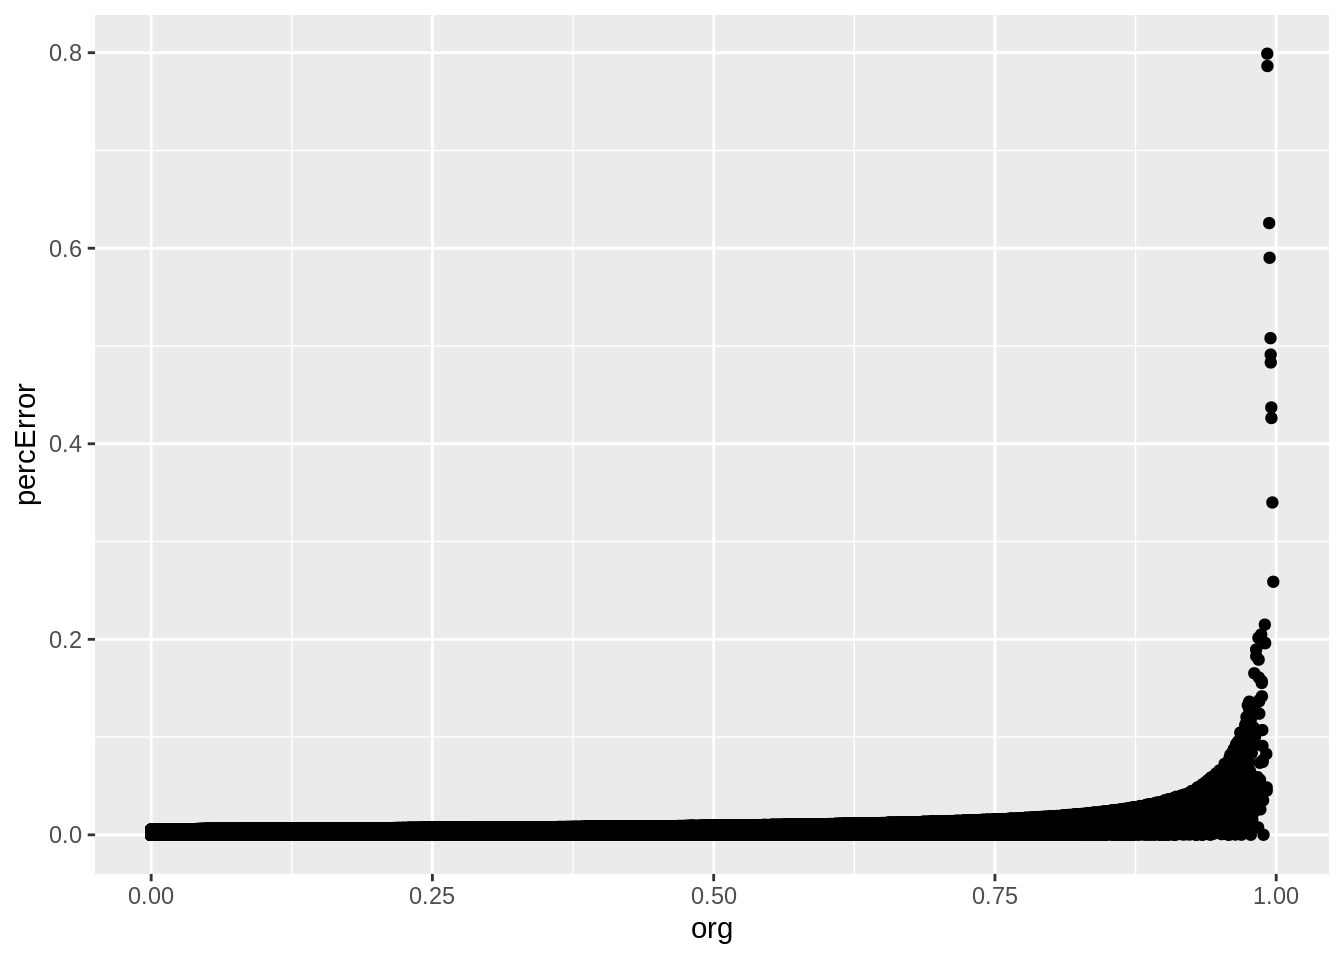
So, according to this, we are only introducing error at 0.798992%, which isn’t much. And the values look like the are well correlated, so we should be good.
Now, how do these approaches compare when using c++?
C++
So it’s a fair comparison, the code below actually writes the c++ program we are going to use, with the random numbers for the p-value calculation stored as part of the code file.
A couple of notes:
- To be fair, both versions of the code have the set of random numbers and the lookup table as
floatvariables, so that there is no difference in each for memory allocation.
- Neither one stores the results of the calculation, we don’t need it for this demonstration.
Raw calculations
cppRaw <- c('#include <iostream>',
               '#include <boost/math/distributions/chi_squared.hpp>',
               'int nVal = 1000000;',
               'double dof = 1.0;',
               'int i;',
               paste('float randVals[1000000] = {', paste(as.character(randomData), sep="", collapse=", "), '};', sep="", collapse=""),
               paste('float pTable[250001] = {', paste(as.character(pTable), sep="", collapse=", "), '};', sep="", collapse=""),
               'int main() {',
               'using boost::math::chi_squared_distribution;',
               'chi_squared_distribution<> myChi(dof);',
               'for (i = 0; i < nVal; i++){',
               '1 - cdf(myChi, randVals[i]);',
               '};',
               'return(0);',
               '};')
cat(cppRaw, sep="\n", file="cppRaw.cpp")

system("g++ cppRaw.cpp -o cppRaw.out")
system("time ./cppRaw.out")
cppLookup <- c('#include <iostream>',
'#include <boost/math/distributions/chi_squared.hpp>',
'int nVal = 1000000;',
'double dof = 1.0;',
'int i;',
paste('float randVals[1000000] = {', paste(as.character(randomData), sep="", collapse=", "), '};', sep="", collapse=""),
paste('float pTable[250001] = {', paste(as.character(pTable), sep="", collapse=", "), '};', sep="", collapse=""),
'int main() {',
'using boost::math::chi_squared_distribution;',
'chi_squared_distribution<> myChi(dof);',
'for (i = 0; i < nVal; i++){',
'pTable[(int(randVals[i] * nVal))];',
'};',
'return(0);',
'};')
cat(cppLookup, sep="\n", file="cppLookup.cpp")
system("g++ cppLookup.cpp -o cppLookup.out")
system("time ./cppLookup.out")So bypassing boost in this case is a good thing, we get some extra speed, and reduce a dependency. We have to generate the lookup table first, but the cpp file can be generated once, with a static variable in a class that is initialized to the lookup values. We do have some error, but in our case we can live with it, as the relative rankings should still be pretty good.