Example Timings
Robert M Flight
2019-08-27
Source:vignettes/example-timings.Rmd
example-timings.RmdPurpose
The goal of importedPackageTimings is to help developers determine if any of the R packages their package depends on make loading their package slow.
To accompmlish this, it uses independent R sessions from the future package to time how long it takes to load each of the packages listed in the Imports and Depends fields of the package in question. Although it will take a long time because it only uses a single core at a time (the only way I could get reliable timings), the times seem to be reliable.
Example
For example, lets look at a Bioconductor package I’ve seen take a long time to load, xcms.
# not run
library(furrr)
plan(multiprocess)
library(importedPackageTimings)
xcms_time = imported_timings("xcms")
The package provides two types of timings, the time required for the import to load (type = pkg), and then the time required for the package to load after the dependency (type = after).
library(importedPackageTimings)
data("xcms_time")
knitr::kable(head(dplyr::select(xcms_time, -timings)))| package | med | min | max | type | which |
|---|---|---|---|---|---|
| xcms | 4777753784 | 4540154629 | 5047299157 | pkg | self |
| xcms | 120612 | 118835 | 153174 | after | self |
| mzR | 695070041 | 654965228 | 726937410 | pkg | import |
| mzR | 4188562694 | 4100112954 | 4393323772 | after | import |
| BiocGenerics | 146176624 | 132330703 | 160247180 | pkg | import |
| BiocGenerics | 4520280675 | 4330646417 | 4579202503 | after | import |
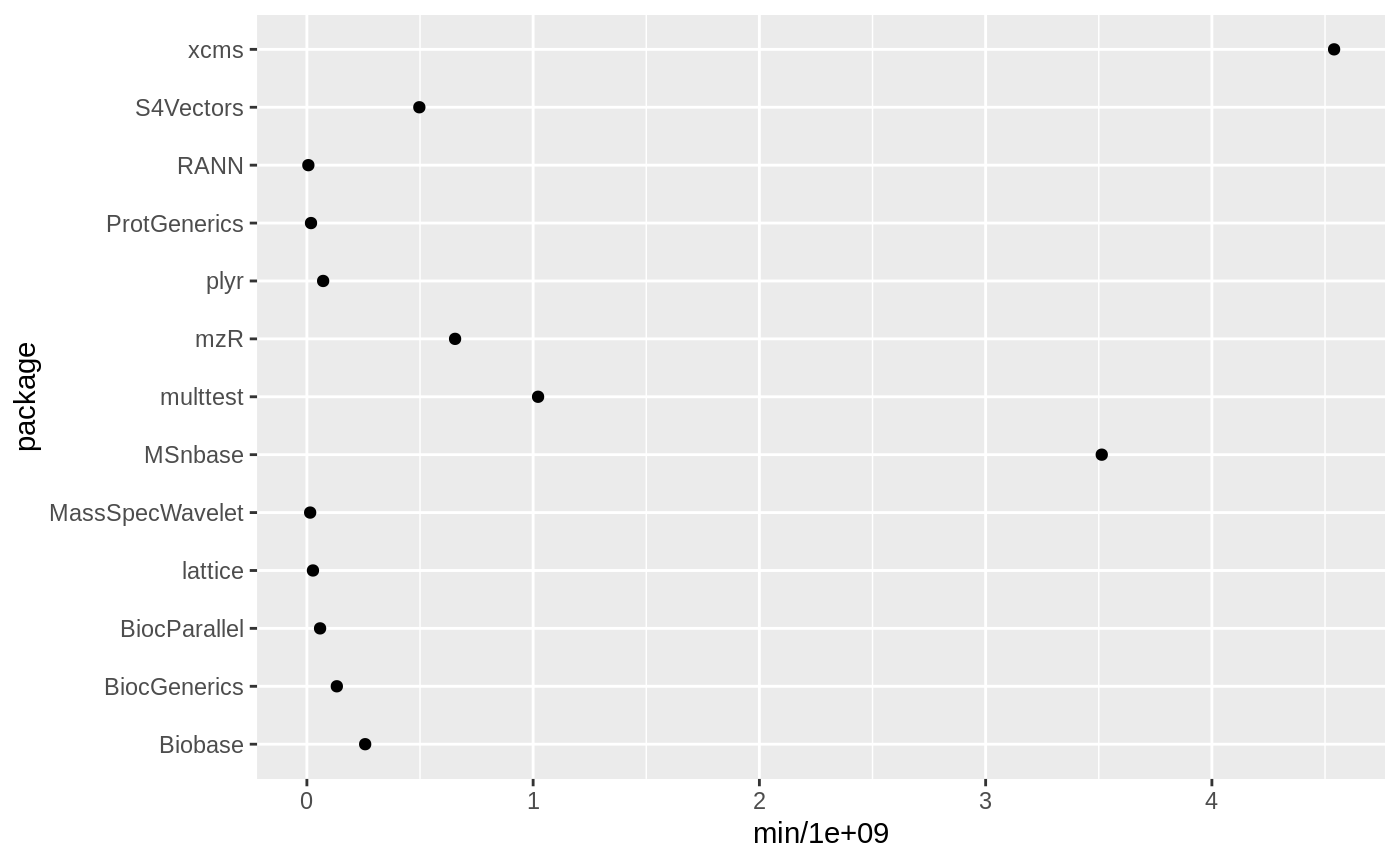
We can use the pkg entries to see which imports actually take a long time to load, possibly contributing to the long load time of our package in question.
library(ggplot2)
ggplot(dplyr::filter(xcms_time, type %in% "pkg"),
       aes(x = min / 1e9, y = package)) +
  geom_point()
From this plot, we can see that MSnbase looks like it is taking the longest to load outside of xcms itself.
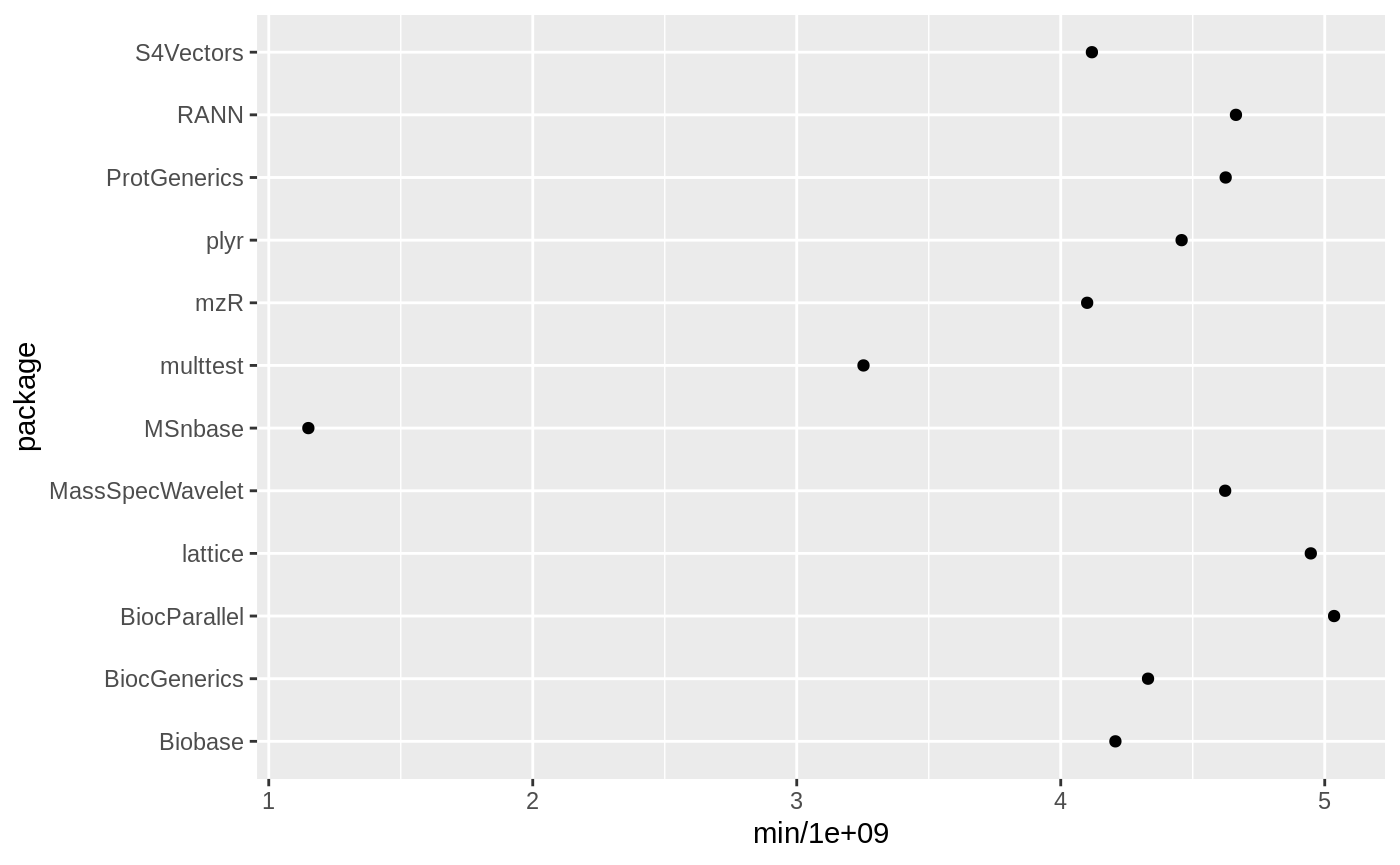
We can use the after entries to see which imports after loading have the smallest time to load our package in question, which implies they may be the culprit causing long load times.
ggplot(dplyr::filter(xcms_time, type %in% "after", which %in% "import"),
       aes(x = min / 1e9, y = package)) +
  geom_point()